


Climate News and Weather Forecasts, but Climate Data May Be Hard to Find
With a large loss [hundreds at least] of employees, some very experienced, we can expect delays in the gathering, distribution and interpretation of weather and climate data. The pending closure of the NOAA Center For Weather And Climate Prediction at the University of Maryland is one example of the challenges ahead. See photo: Michael A. McCoy/Bloomberg via Getty Images.
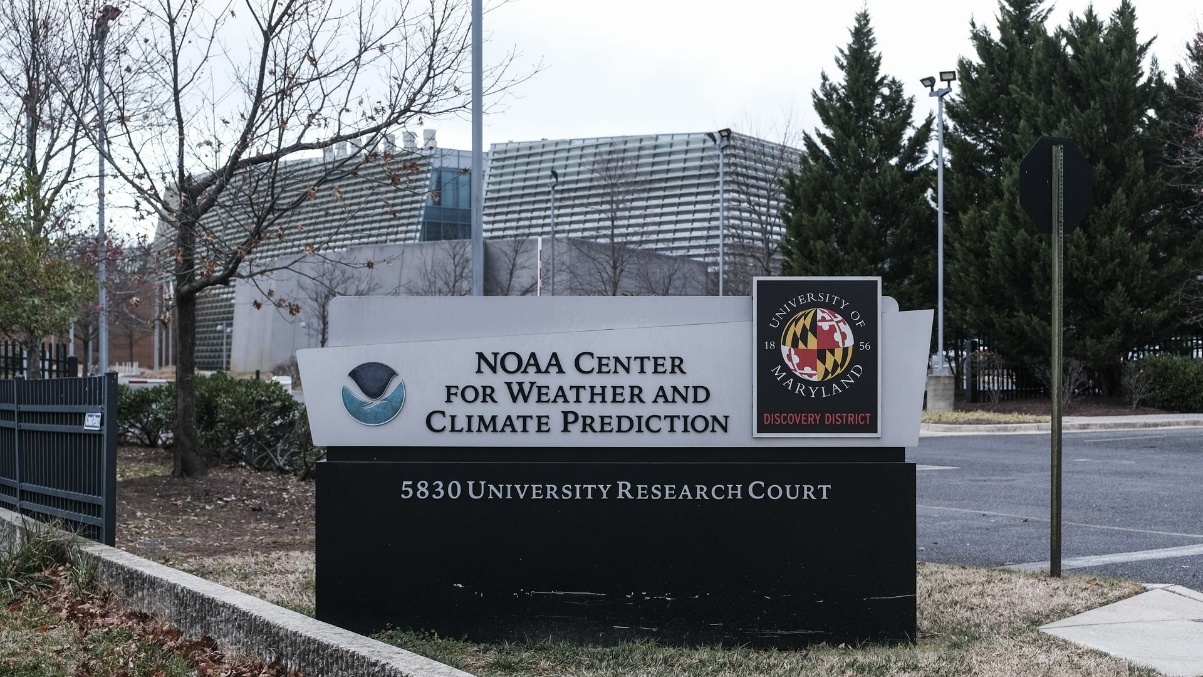
NOAA's Center for Weather and Climate Prediction headquarters in College Park, Md. Photo: Michael A. McCoy/Bloomberg via Getty Images.
The Meteorological Office in the United Kingdom is still open for business, as are others in France, Germany and more. The Met Office touts their achievement with this image [labeled Met Office] with this statement: “Our 4-day forecast is now as accurate as our 1-day forecast was 30 years ago.

”The Met Office is an example of steady leadership, investment and the benefit of science.
Meanwhile, the Scripts Institution of Oceanography at UC San Diego, collects and publishes data on the levels of the primary greenhouse gas, carbon dioxide [CO2], in the atmosphere. They predict that in May 2025 the level of this gas will reach 429.6 parts per million [ppm], the highest concentration in the atmosphere in over 2 million years. See the saw-tooth curve titled “Atmospheric CO2 concentration at Mauna Loa.”
This graph, also called the Keeling curve, summarizes all the data from when direct measurements of atmospheric CO2 were first made in 1958 by Dave Keeling.
However, there is another important aspect to this Keeling curve. We are beginning to see [note the circled portion of graph] that the increasing amount of this GHG is rising faster than ever and will exceed the level to keep global warming to less than1.5 degrees Centigrade. This is the target amount agreed to by all 190 countries that signed the Paris Climate Agreement in 2015.
Not good.
But there is more. There is no doubt that the North Country has experienced a hard winter in 2025. Some 10-12 polar vortex storms have rolled across Canada and the U.S. in the past few months, and in February, it brought twice the normal amounts of snow to Plattsburgh.
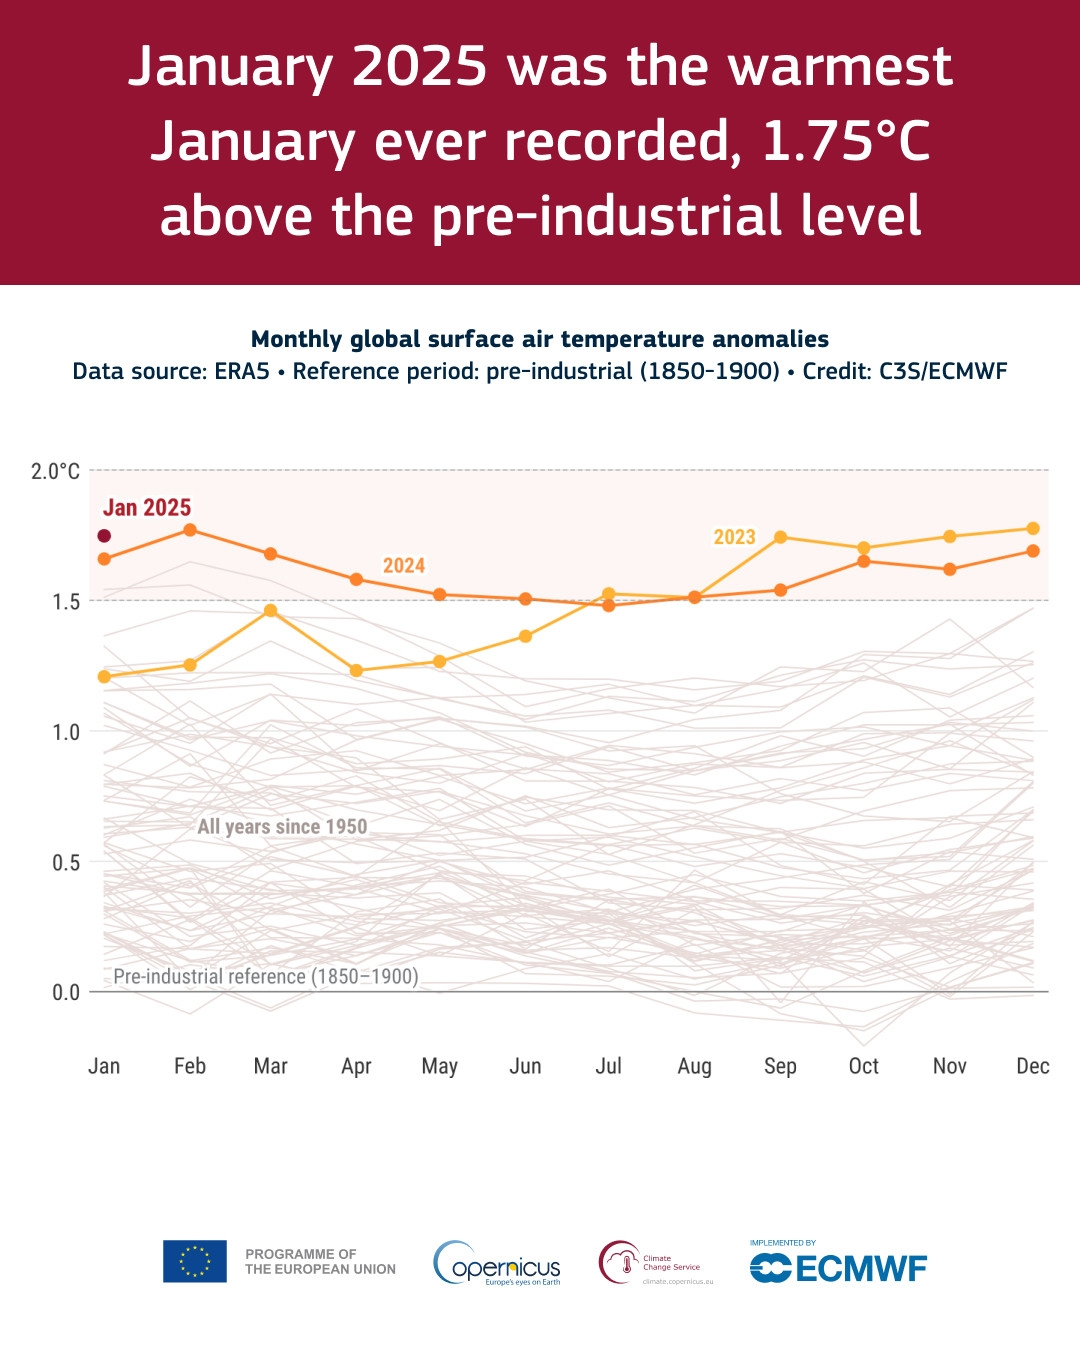
But as much as we might like to think, Plattsburgh is not the center of the world. January 2025 air temperatures [globally] made January the warmest on record. See the horizontal line graph titled, “Monthly global surface air temperature anomalies.” January 2025 is that one dot at the top left in this graph above all the earlier January data.
Indeed, while we may have been shivering here in mid-February with single digit and occasional below zero temperatures, the North Pole set records of its own. It was at or just above freezing [32 degrees F] and was about 20 degrees Celsius [about 38 degrees F] warmer than the average set between 1991 and 2020.
Meanwhile, 46 years of satellite measurements showed that the Arctic had about 85,000 square miles less ice than the previous February record low set in 2018.
Meanwhile, our new national policy is to increase fossil fuel production, which will further increase GHG emissions, as well as cut all funding for renewable energy, solar, and wind projects.
This could be called societal suicide.
Also, not good.
But some states are stepping up to the plate with policies that encourage and foster renewable energy production and allow people to have control over their energy systems. But many states are not. Progress is occurring, however, and the most recent assessments are listed here. See the image/chart/data information from Paul Horn, Inside Climate News titled, “Illinois Leads in Energy Democracy Rankings.”
“The Institute for Local Self-Reliance advocates for locally owned energy systems, community choices, and protection from being financially abused by utility companies.” [Inside Clean Energy. Newsletter, 2/27/25.]
It evaluates nationwide utility companies on 18 criteria from “net metering” to impediments in developing “community solar” among others. None of the 50 states get an “A” and only one state gets a “B”; and that is Illinois at 76%. “All of their policies sort of create an environment to allow widespread ownership and development of clean energy at the local level.” Note the 5 color codes and Grades in the Chart.
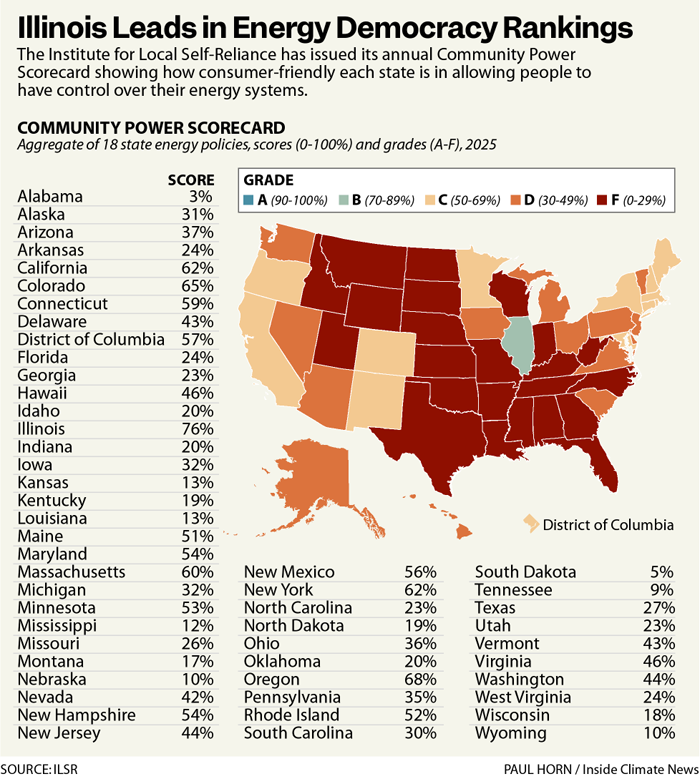
Alabama, of all the 50 states, gets the lowest grade, 3%. The east-coast and west-coast states get the higher grades and are among the leaders.
“Nature is always hinting at us. It hints over and over again. And suddenly we get the hint.” --- Robert Frost
And so it goes.
The scientific career of Raymond N. Johnson, Ph.D., spanned 30 years in research and development as an organic/analytical chemist. He is currently founder and director of the Institute of Climate Studies USA (www.ICSUSA.org). Climate Science is published monthly.