


Climate Reports, Warnings and Progress on Renewable Wind Power
OK, let’s do a “reality” check. According to the dictionary, the definition of reality is “an occasion on which one is reminded of the state of things in the real world.
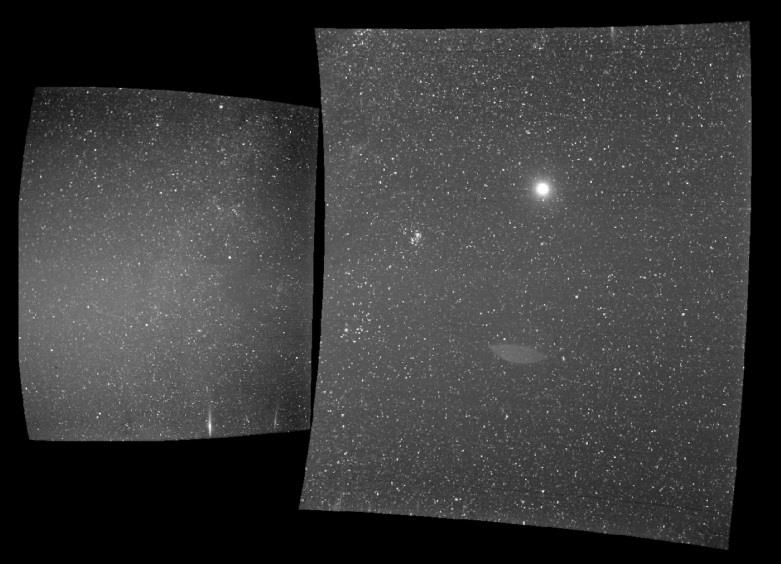
”So, first let’s look at the sky photo [ ignore the left image] taken by the new Parker Solar Probe on September 25 th 2018. In the right-hand image Earth is the bright spot near the center amidst a field of stars. This image was taken when the space craft was some 27 million miles away.
Yup. Nothing has changed here. Our planet is still alone amidst the far-flung stars of our Milky-Way Galaxy with no Planet B nearby.
The seven year Parker Probe mission is intended to study the Sun in more detail than ever before. It will monitor the diffuse, hot corona and the solar wind in order to further understand the workings of the Sun and how this may impact Earth’s telecommunications systems, weather and climate.
OK, so how are we doing with carbon dioxide [CO2] emissions?
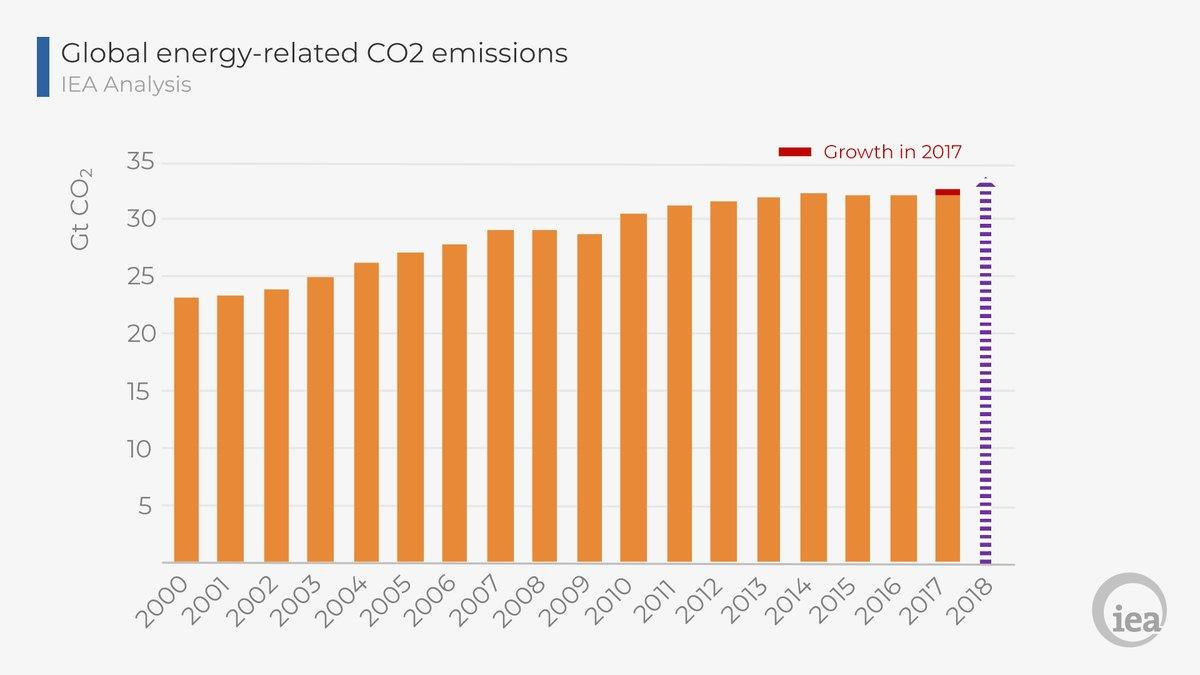
The “reality” check here is not so good. Let’s look at some data from the International Energy Agency [iea].
The vertical bar chart from the iea shows the Gt [gigatons or billions of tons] of GLOBAL energy-related CO2 emissions, from all sources, for each year from 2000 to 2018 [estimated]. Even with the 2015 Paris accords signed by over 195 nations on the planet obliging nations to develop their own goals to reduce emissions, the levels of this greenhouse gas [GHG] are still increasing.
In early October the UN released report #SR15 from the Intergovernmental Panel on Climate Change [IPCC]. It discusses recent climate data and the tone is increasingly serious, urgent, and almost alarming. The threat of increasing global emissions of carbon dioxide and increasing our global temperatures to 1.5 degrees C [or 2.7 F] will have major consequences on Earth’s climate systems. Remember the hot days this summer, Hurricane Florence in September, Hurricane Michael in October which went from a category 1 storm to a category 5 in just 24 hours?
However, for the U.S. there’s a small bright spot. Let’s look at the second bar chart from the U.S. Energy Information Agency [eia].
Total U.S. fossil fuel emissions fell slightly in 2017.
Really? How can this be?
Again, let’s look at the data!
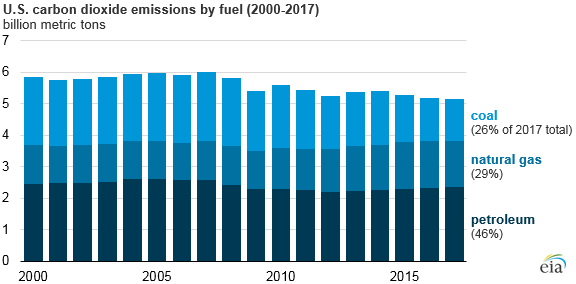
The vertical bar chart titled “U.S. carbon dioxide emissions ... (2000-2017)” reflects this trend. Each vertical bar represents a year with the share of each of the three fossil fuels illustrated; starting at the top of each bar we have “coal”, then natural gas” and at the bottom, “petroleum.” These are identified to the right. The left-hand axis shows these emissions in “billion metric tons.”
In the bar chart we can see one fossil fuel that is shrinking; coal.
There are many reasons for this emissions reduction. Two important ones are the recent closure of a significant number of coal-fired electric generation units [with 2018 on track to set a record]; and significant increases in renewable wind energy installations across the country. [The solar contribution is another story for later.] There are now over 57,000 wind turbines in the U.S.
So why is this happening, what’s going on?
Basically it’s money! The cost of generating electricity using coal is much higher than from wind. Falling costs have made wind turbines more competitive even considering the higher subsides for fossil fuels. In addition, total U.S. renewable energy sources in first half of 2018 surpassed nuclear!
And yes, we have one more bar chart to examine that tells more of the story; “U.S. wind electricity net generation ...”. The vertical bars start at year 2000 on the left and end on the right at 2018 [first three quarters].
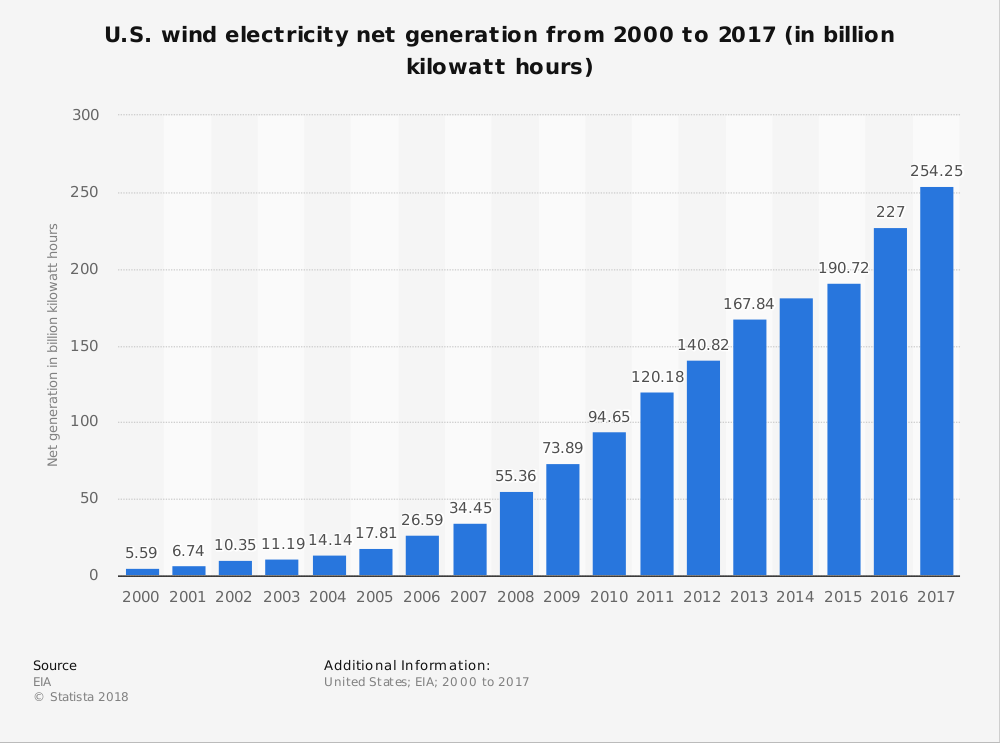
This reflects an enormous amount of new electrical generation, especially in the past 8-10 years, which is cheaper than the power from coal fired plants! This is a very positive trend and indications are that it will continue!
This electricity from wind power is absolutely critical as we need to cut in half our global CO2 emissions over the next 12 years [as per IPCC report] to avoid the most serious climate and weather disruptions that we are beginning to experience.
And this is a tall order.
We need to get moving, ... , now.
The scientific career of Raymond N. Johnson, Ph.D., spanned 30 years in research and development as an organic/analytical chemist. He is currently founder and director of the Institute of Climate Studies USA (www.ICSUSA.org). Climate Science is published monthly.