


Phenology: It’s All In The Timing
Yes, Nature has a calendar too. Humans use the Equinoxes [March 21, September 21] and the Solstices [June 21 and December 21] to take a measure of the year, together with Daylight Savings Time and more, in order to mark our celebrations and activities. Nature’s calendar, phenology, is “when cherry trees bloom, when a robin builds its nest and when leaves turn color in the fall” as per the National Phenology Network [NPN].
And according to the NPN website, “Changes in phenology are the ‘fingerprint’ of climate change.”
Biological reproduction with migration cycles of birds, the flowering of plants and trees, movement of mammals, and other species, are triggered by and respond to the environment and climate with which they have had generations of successful reproductive experience. When those environmental clues change over a short period of time, those biological cycles, including migration, may now be out of sync with other factors for reproductive success and the population decreases.
Let’s look at a graph with the wavy horizontal line [NOAA Climate.gov]. The bottom axis covers the last 11,000 years in the climate record and is labeled “Years Before Present.” The axis on the left is related to temperature. The zero degrees line [made of dots] represents the 30 year average over the period 1961 – 1990. The differences in temperatures over these millennia, compared to the recent 30 year average, range from about +0.4 degrees to about -0.4 degrees. Thus, over this long period of time our planet’s temperature varied over a very narrow range.
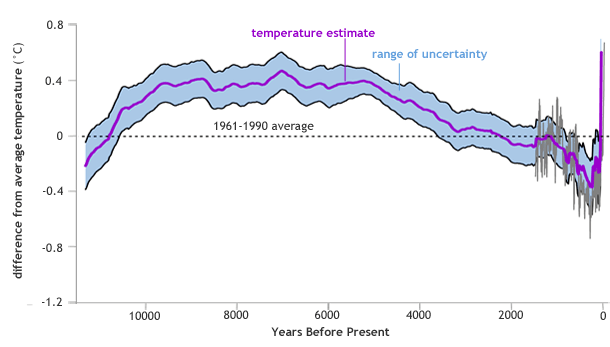
What is interesting is the fact that this relatively stable climate coincided with the human shift from hunter/gatherer to farmer/animal herder. Over the past 100 years, however, temperatures have risen from near the lowest to the warmest levels in the last 11,000 years. See sharply rising line at the right. This recent 100 year period is also when carbon dioxide and other heat trapping gases have increased significantly. This almost 2 degree Fahrenheit increase, or about 1 degree Centigrade, for the whole planet on average is having a profound impact on our climate, weather and also phenology.
This temperature increase has changed the spring snow cover extent. See the vertical line bar chart labeled “Not the Snows of Yesteryear,” from InsideClimate News. The left hand axis shows the extent of spring snow cover in the Northern Hemisphere in “Square Kilometers [millions]” with the years 1967 - 2019 along the bottom. This 52 year dataset show that the snow cover today is about 2.7 million square kilometers less than it was in the recent past. This snow cover change has had a big impact on the migration habits of robins.
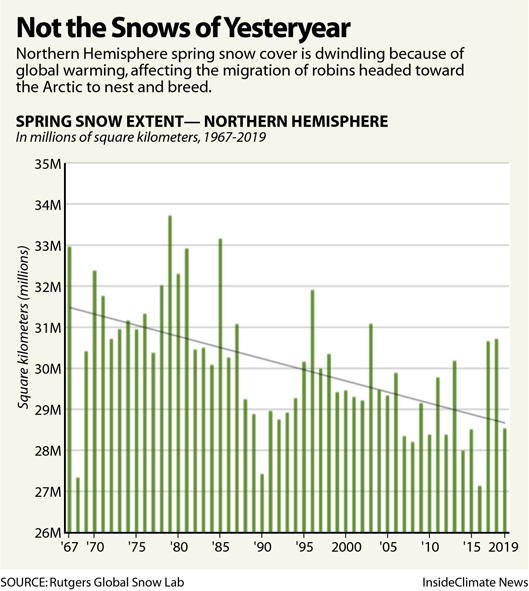
Built into their genetic code, this environmental trigger of reduced snow cover, as well as perhaps other factors, causes robins [as well as other species] to start migration earlier. This has resulted in major challenges for these birds. As they move north their food sources may not have become as available as usual and mortality and breeding success may be impacted.
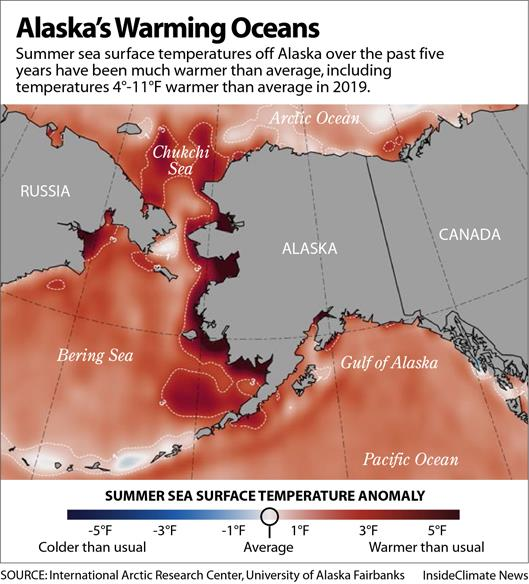
Now let’s couple this phenology event or change with the map labeled “Alaska’s Warming Oceans.” In the image the state of Alaska [AK] is centered, with Russia to the left, and Canada to the right. The darker shaded area along the coast of AK indicates ocean temperatures that are 4 – 11 degrees warmer than average.
This warmer water has had a profound impact on the fisheries according to the North Pacific Fisheries Management Council. For the first time ever, the extremely low cod numbers led to the closure of the Gulf of Alaska fishery. The fish have either died or moved away to cooler waters. It is not only cod, but also salmon that has been impacted by low water in rivers caused by drought, along with many other smaller species.
The short-tailed shearwaters birds migrate to this section of the AK coast annually and usually fatten up on krill and small fish for their migration back to southern Australia to breed. In November 2019 thousands of these birds were washing up dead on Australia’s beaches. There were “incredible fish shortages” in the northern Pacific Ocean region by AK [www.globalresearch.ca/gulf] and the birds starved during their 10,000 mile trip back south.
See photo [Associated Newspapers Limited] of shearwaters washed up on beaches near Sydney AU.
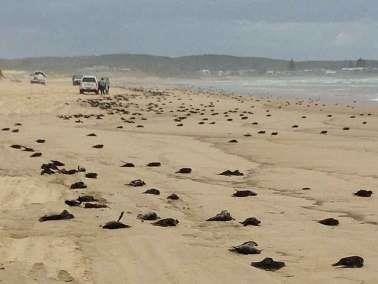
Estimates are that the total loss during this migration event is on the order of hundreds of thousands of birds. Their migration timing was the same but the food sources had moved.
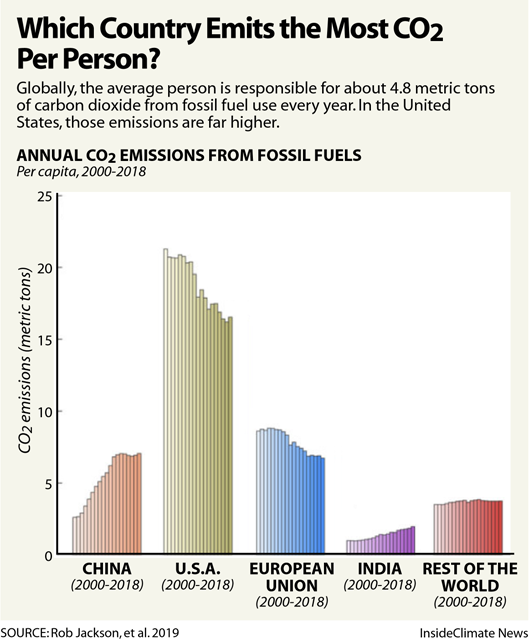
With carbon dioxide as the major greenhouse gas causing climate change, the United States has the largest per capita carbon footprint on Earth. See the bar chart from InsideClimate News labeled, “Which Country Emits the Most CO2 Per Person?” It’s nice to be number one in a track meet or a ball game, but here? Not so good.
We have got some work to do.
In one way perhaps the COVID-19 virus is pushing us in a new direction as evil and deadly as it is. In January 2020 world oil consumption was 100 million barrels of oil per day. Now it is about 65 million barrels of oil per day. The virus is causing a seismic shift in the fossil fuel sector with many companies going bankrupt and opens an opportunity to change our habits and awareness of what is possible.
The scientific career of Raymond N. Johnson, Ph.D., spanned 30 years in research and development as an organic/analytical chemist. He is currently founder and director of the Institute of Climate Studies USA (www.ICSUSA.org). Climate Science is published monthly.