Change is in the Air, and That Does Not Mean the Seasons
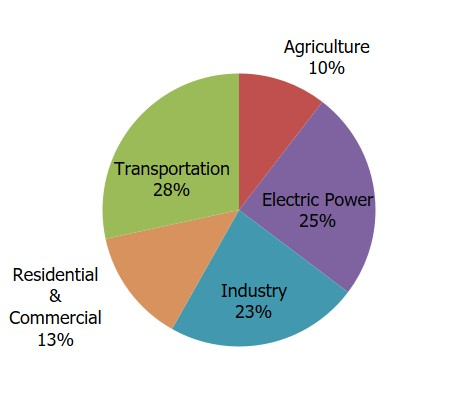
Let’s review, for a moment, and take another look at the sources of carbon emissions in the U.S. with this circular chart from the EPA [Environmental Protection Agency]. Recent government policy has been to focus on two of the major sounces of carbon dioxide emissions;
namely “Transportation” at 28% of total U.S. emissions and “Electric Power” at 25% of total U.S. emissions.
The other sectors of the U.S economy also being addressed includes “Agriculture” at 10%, “Residential & Commercial” at 13% and “Industry” at 23%. The carbon emissions from all of these sources are collectively responsible for our changing climate and increased extreme weather events.
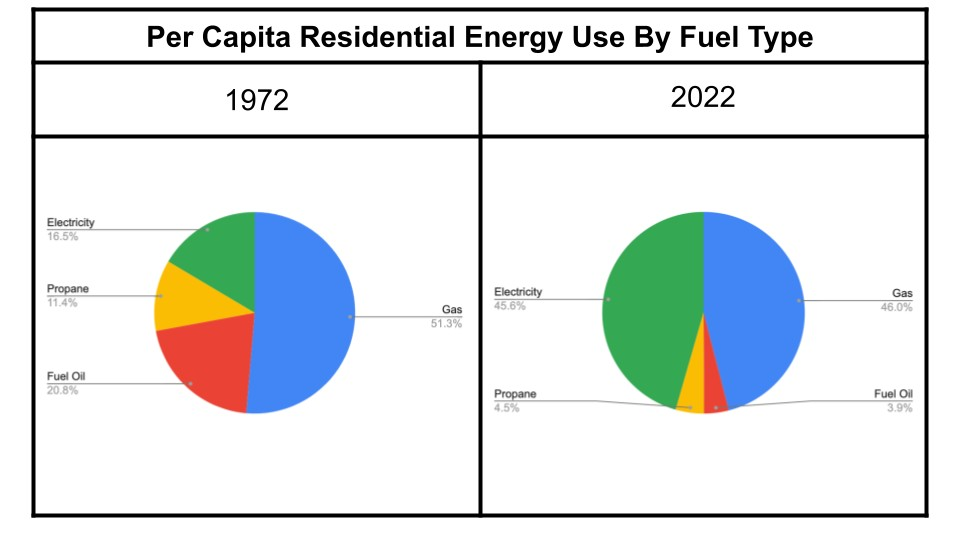
An interesting perspective from 50 years ago is the change in the consumption of fossil fuels used by Americans in their homes. See the two circular charts in the boxed image, “Per Capita Residential Energy Use By Fuel Type.” This data is from the Energy Information Administration [EIA] and published in an article in CleanTechnica by Joe Wachunas in May 2024.
Per capita residential fossil fuel consumption is down by almost 50% over the past half century while electricity use has almost doubled. It seems that the “electrify everything” movement actually started decades ago. We must keep in mind however, that the population of the U.S. in 1972 was about 210,000,000; or 210 million. Our total population in 2024 is now about 340,000,000.
Obviously, the dynamics of American society have changed in major ways over the past half century: from the cars, SUV’s and pickup trucks we drive, to the shopping we do, environmental laws passed by Congress, technology, land use changes and a lot more. There has been a dizzing array of factors that have all contributed to our changes in energy consumption and carbon emissions.
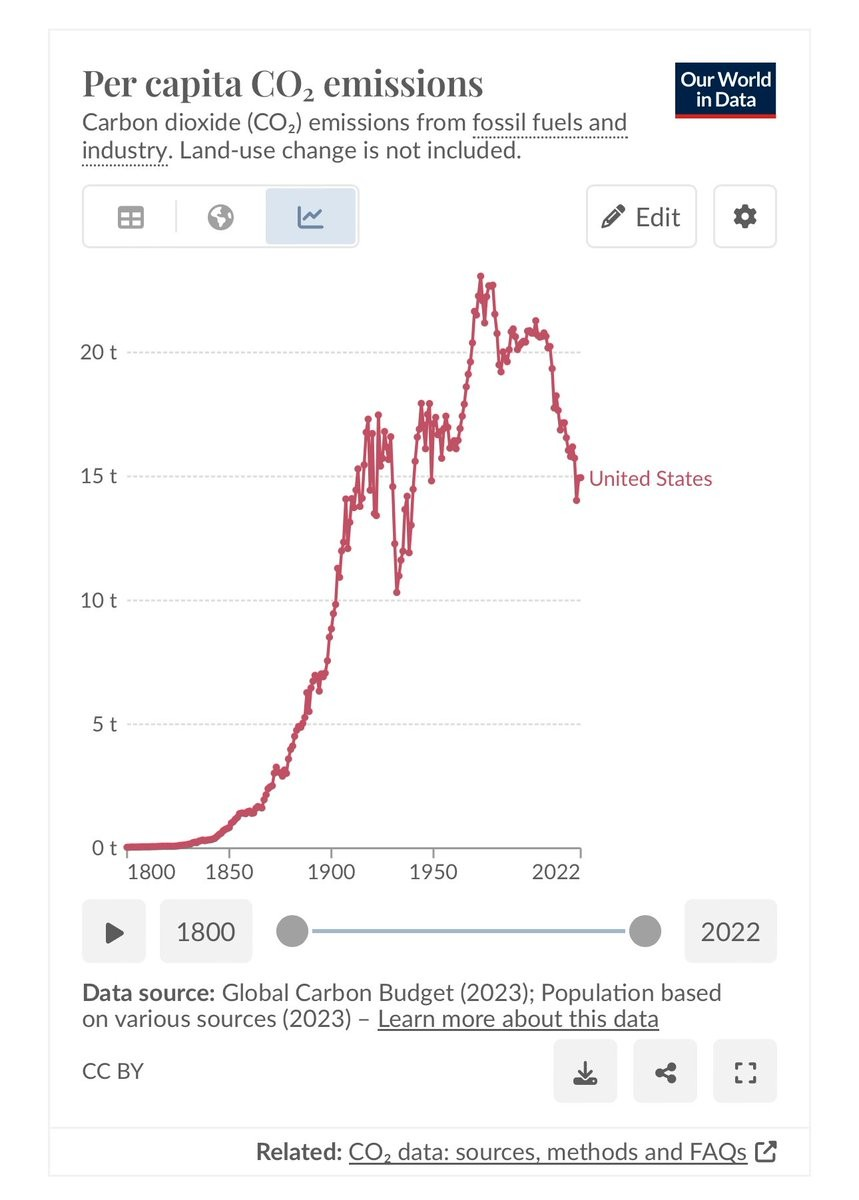
This same article in CleanTechnica also included that our per capita carbon dioxide emissions in 1972 was about 22 metric tons [per person], compared with 14.4 metric tons in 2022 [data from Statista]. Now that is progress.
In addition, the gross U.S. CO2 emissions have decreased by about 3% since 1990. See the graph with six horizontal lines, titled “U.S. annual energy-related CO2 emissions by sector (1990 – 2023)” from the U.S. Energy Information Administration, March 2024. Today, the annual U.S. CO2 emissions are estimated to be about 4.9 billion tons.
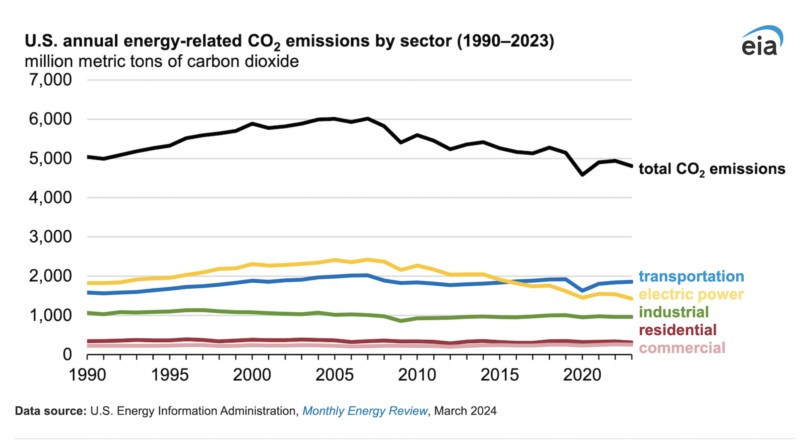
Another interesting trend in this same graph is that of “electric power.” The carbon emissions from this source peaked in about 2006 - 07 and have been trending down since then. This is due in part to the use of natural gas instead of coal, but also to the generation of electrical power from solar, wind, geothermal and hydropower. Nuclear energy suppy has not changed much in the past 20 years: the high cost of construction and high cost per kilowatthour has has slowed the buildout of this energy source.
Let’s continue with this theme of carbon emissions for a moment.
See the graph titled, “Per capita CO2 emissions.” This graph traces the carbon emissions [in tons] for the last 222 years and was produced by “Global Carbon Budget (2023)”. In 1800 the emissions per person were negligable but then began a gradual increase before they reached an initial peak in about the 1920’s. The ‘Great Depression’ caused a big drop in emissions in the 1930’s and then they picked up again to a peak in the mid 1970’s, before beginning a decline again.
OK, so what is the problem? Per capita carbon emissions are decreasing, renewables are increasing, and technology has helped us be more efficient; these are a few of the many factors having an influence on carbon emissions. Another big one is population growth: more people on the planet translates to the need and consumption of more energy and resulting carbon emissions.
The problem is that carbon emissions do not go away any time soon. They are additive. What we add to the atmosphere today, is added to what we put there yesterday, … and to what we added decades ago. It is estimated that CO2 in the atmosphere can hang around for a long time with some lingering for hundreds to thousands of years.
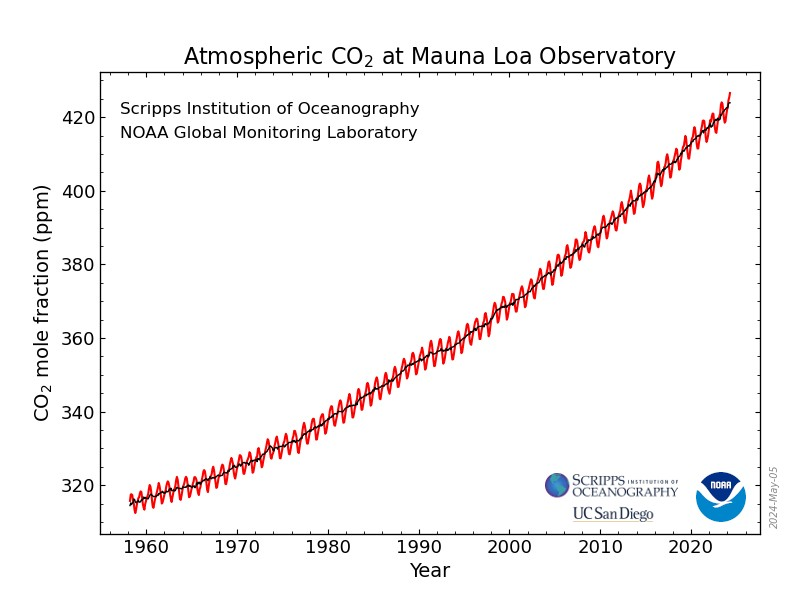
Note the wavy graph titled, “Atmospheric CO2 at Mauna Loa Observatory.” Data compiled by Scripts Institution of Oceanography and University of California, San Diego. This one graph over a period of 60 plus years tells the story.
Although trees and the biosphere absorb some carbon, and the oceans too, our carbon emissions just don’t go away any time soon. Direct measurements todayshow that the CO2 levels in the atmosphere [May 2024] are 426 parts per million, the highest in 4.3 million years when Earth’s temperature was some 7 degrees Fahrenheit hotter and sea levels were about 75 feet higher than today.
This assessment was reported by scientists at University of Colorado, Boulder. It appears that we have to go not only to “Net Zero” carbon emissions in the near future but to “Net Negative”. We may have to find ways to remove carbon dioxide from the air directly; but this is a story for another time.
Ah, so much data and so little time.
And so it goes.
The scientific career of Raymond N. Johnson, Ph.D., spanned 30 years in research and development as an organic/analytical chemist. He is currently founder and director of the Institute of Climate Studies USA (www.ICSUSA.org). Climate Science is published monthly.


