Climate Chaos: Climate Anxiety and the S-Curve
This and That; Climate Chaos Has Many Fronts September 2023 was the month that was. Or was that August? Or July? It is getting hard to remember with extreme weather events of all kinds; fires, floods, and temperature extremes happening so frequently.
In late September in New York City people turned out by the tens of thousands to put pressure on the UN, its representatives, and political leaders to take stronger action on climate change and climate chaos. Indeed, it is estimated that some 2 million people around the world were protesting at the same time the lack of action by responsible adults in combatting climate chaos.
But look at the front lines of some of the protestors as seen in the image [Sarah Blesener for The New York Times]. The people are all young. Most of them probably are not even able to vote.
They don’t have any political power; their financial resources are probably limited; they are not CEO’s or senior executives of business; but they will inherit the world we are handing off to them in the near future. And they are frustrated with many feeling the mental stress of what they see is a dark future. Many wonder if they even have one.

These feelings of loss, abandonment, and uncertainty, by many, mostly young but not all, is being recognized by the medical community. “Mental health clinicians are seeing more patients come in with symptoms of climate change anxiety, alsocalled eco-anxiety, eco-grief, or climate doom, and they are not always sure what to do about it” [Yale Sustainability, March 13, 2023].
According to Sarah Lowe, a clinical psychologist and Associate Professor in the Department of Social and Behavioral Sciences at Yale School of Public Health, “Climate anxiety is fundamentally distress about climate change and its impacts on the landscape and human existence” [see same March 13, 2023, article from Yale].
Are we making any progress that would address some of these concerns?
Let’s digress a moment and take a look at what is called “The S-Curve.” See the illustration with the left axis labeled “Performance of innovation” and the bottom axis labeled “R/D effort”. An innovation such as the technology associated with solar panels goes through a slow and gradual “Ferment” stage. As the “Quality” goes up and the “Cost” comes down, the “take off” portion of the curve starts to rise more steeply as its acceptance and benefits become more widely embraced. Eventually as the market becomes more saturated the “maturity” portion of the curve is reached.
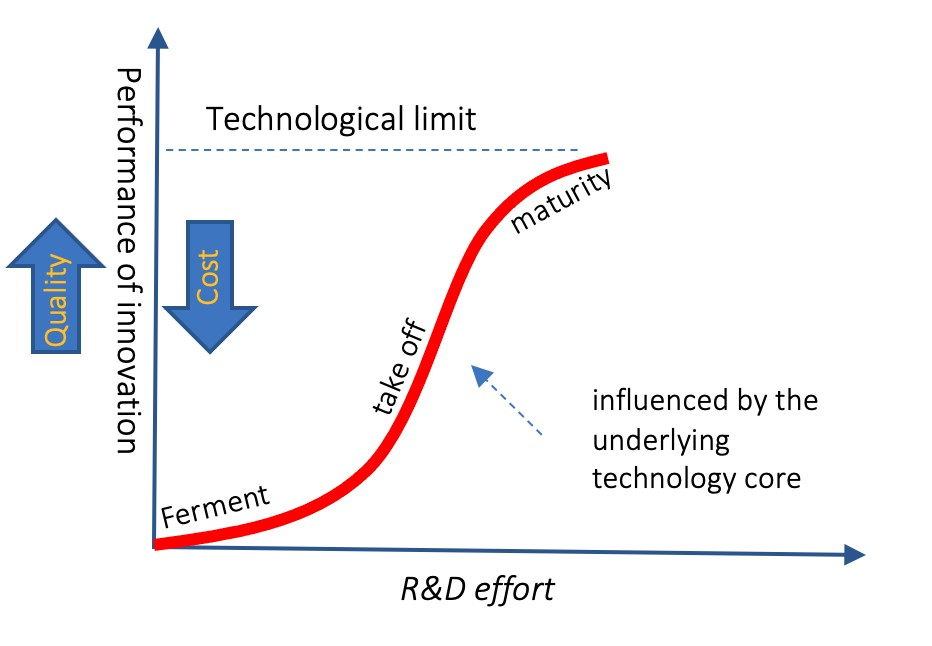
What does all of this mean?
Some 60% of the carbon dioxide and other greenhouse gas emissions in the U.S comes from two sectors, Transportation, and Electricity generation. Some think tanks and futurists think they see in the data for both those areas that we are inthe “takeoff” part of the S-curve, and that we are in the midst of a major transition in these two areas.
Today let us focus on the Electricity generation sector and how the mix of technologies used to do just this is changing. The electricity we use is getting greener all the time.
Please see the bar chart titled, “Cumulative utility-scale electric generating capacity additions, United States [2023]”. The chart is from the U.S. Energy Information Administration.
The left-hand axis is labeled in gigawatts [added]. At the bottom of the chart are the months of the year. The year 2023 starts off slowly with just a few gigawatts added in January, and then steadily increases through June, as supply chain issues are worked out and the seasonal time for outdoor construction improves.
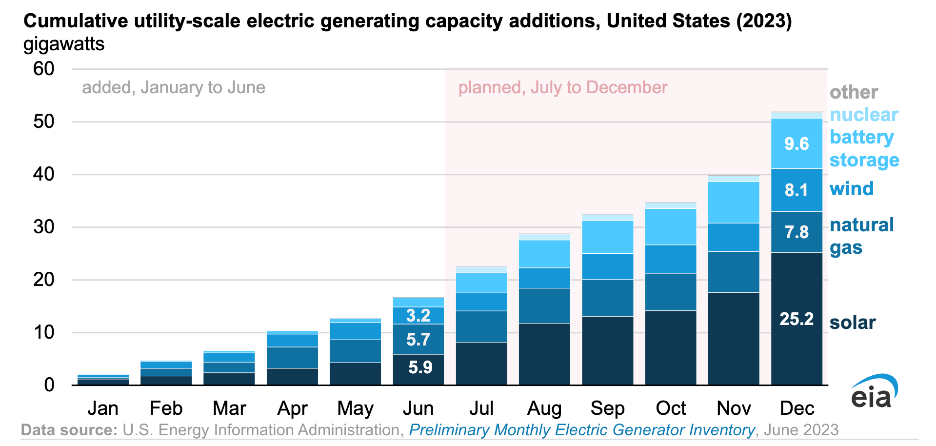
The final six months of 2023 are projected based on pending and approved permits, worker availability, sitework and other factors but data through the 3rd quarter suggest those numbers are on track.
Note the December installation numbers. 25.2 gigawatts [GW] of solar will have been added this year; 7.8 GW for natural gas, 8.1 GW for wind, and 9.6 GW for battery storage. Our grid is getting cleaner! No new oil or coal fired generation plants are scheduled to be built. Less GHGs are being emitted for the energy we use.
And … the rate of installations year-over-year is on that early portion of the S-curve labeled “take-off”. As the installed costs continue to drop [current costs of solar generated electricity are far cheaper than that from fossil fuel plants], more capital is made available, and the momentum increases.
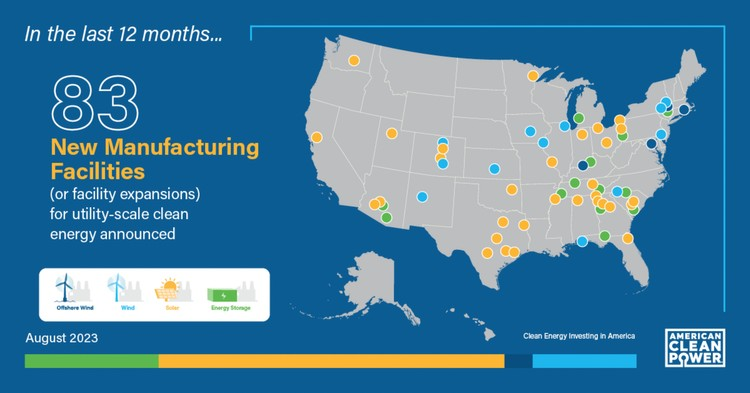
We are not out of the woods yet. Far from it. However the trend is positive. The Inflation Reduction Act is having a strong effect on this progress. Let’s look at one more illustration. It is an image of the outline of the United States.
It goes on to state “In the last 12 months, 83 New Manufacturing Facilities [or facility expansions] for utility-scale clean energy announced.” This activity includes wind, solar, and battery storage manufacturing.
Meanwhile, another image from the Climate March and protest in NYC last month, tells a powerful story. This mother has a sign that says, “I NEED TO TELL MY DAUGHTER I DID NOT STAY SILENT.”

NYC Climate March 9/17/23
The scientific career of Raymond N. Johnson, Ph.D., spanned 30 years in research and development as an organic/analytical chemist. He is currently founder and director of the Institute of Climate Studies USA (www.ICSUSA.org). Climate Science is published monthly.


