


ERoEI and Climate Change
In this era of “disruption” which includes climate change, technology advances and developments in renewable energy, this term “Energy Return on Energy Invested” [ERoEI] is an important one. Some literature may use EROI; “Energy Return On Investment” but they both mean the same thing.
The idea is to evaluate how much energy one “gets”, compared to how much energy was “required”, to obtain a given amount of energy. Obviously an energy source that requires more energy input than one gets back is not economical and the process or company would go bankrupt.
There are a lot of “Myths” and “Misinformation” on-line that suggests that renewables [solar, wind] may require more energy than is actually returned. This is a broad subject and for illustration and comparison purposes only “solar” and “oil sands” [also called tar sands] will be discussed. The solar, of course, is renewable and the second is a fossil fuel, which is not. The oil sands have a very large carbon footprint and when burned produce carbon dioxide which is the greenhouse gas [GHG] that is changing the climate on our planet.
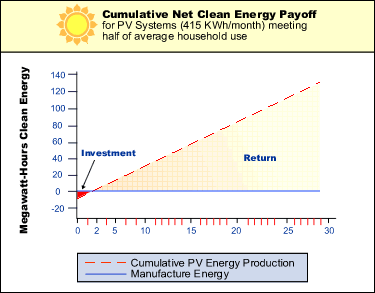
Let’s look at the graph labeled “Cumulative Net Clean Energy Payoff.” This data is from a study by the National Renewable Energy Laboratory and their free report is available on-line. Their data show, as can be seen in the graph, “that the manufacturing energy cost versus the energy production payback for solar modules is generally less than 4 years.” The dataset here shows the payback period is a bit less than 2 years.
This means after that period, the energy investment in the solar panels will provide a net energy return for the remaining solar panel lifespan of about 26 – 28 years.
If we divide energy returned by energy required, we get ~28/2 or a ratio of 14 for ERoEI.
For the oil sands that same ratio would be about 3. This means it takes a lot of energy to put into the oil sands process with much less net energy return. These numbers are approximate and vary depending on the study. Some of the studies include the externalities [air pollution, health, safety – injuries/deaths, carbon emissions etc.] and some don’t.
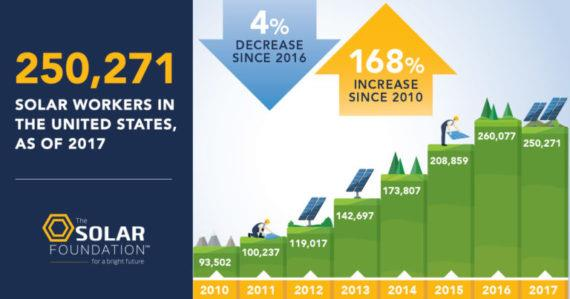
In the case of solar about 250,000 workers in the U.S. are involved in the solar industry [manufacture, installation, etc.]. See illustration from “The Solar Foundation”.
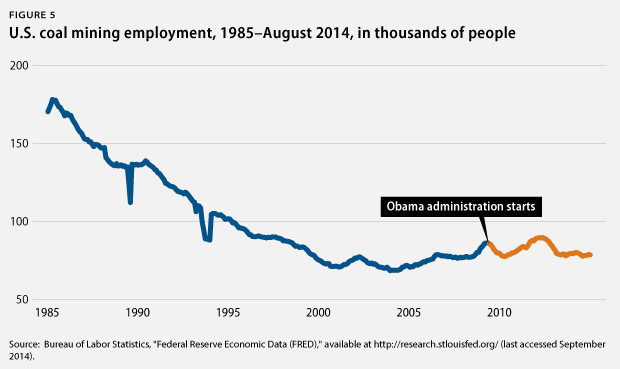
Note the Bureau of Labor Statistics graph labeled “U.S. coal mining employment...” which indicates the industry had as many as 175,000 workers in 1985 compared to about 50,000 today. The graph also shows that during the Obama era the number of miners was relatively constant: so much for the purported “war on coal.”
There was a slight increase in employment numbers in 2017 but the forecast for 2018 suggests a continued decline.
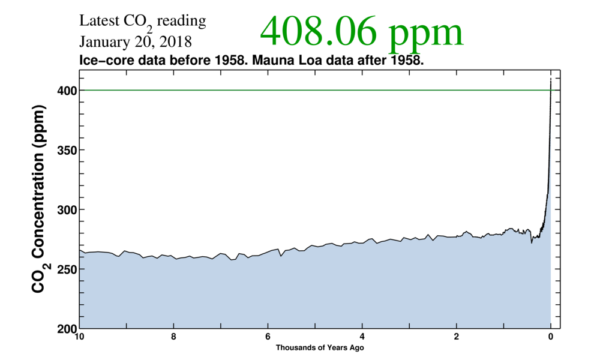
This progress on renewables [solar] in terms of cost and ERoEI comes at a critical time. The graph of “Latest CO2 reading from January 20, 2018” illustrates the concentration of this GHG is over 408 partsper million [ppm]. This number is far higher than anything seen over the past 10,000 years. We are in new territory and the uncertainties as to what happens next, in terms of our extreme weather events, warming oceans and sea level rise support a need for immediate action to address the issue.
In the meantime, entrepreneurs all over the world are using new technologies to create new products that will improve efficiencies and reduce carbon emissions. One example is the driverless electric truck being developed by a new start-up in Sweden. The company, Einride, will have a prototype in service by summer 2018. See photo of vehicle.

The vehicle does not have a cab making more room available for cargo, and will carry goods for the multi-national grocery giant, Lidl, and actually carry products through the streets and traffic of Halmstad, Sweden. The goal is to have one remote driver per 10 trucks.
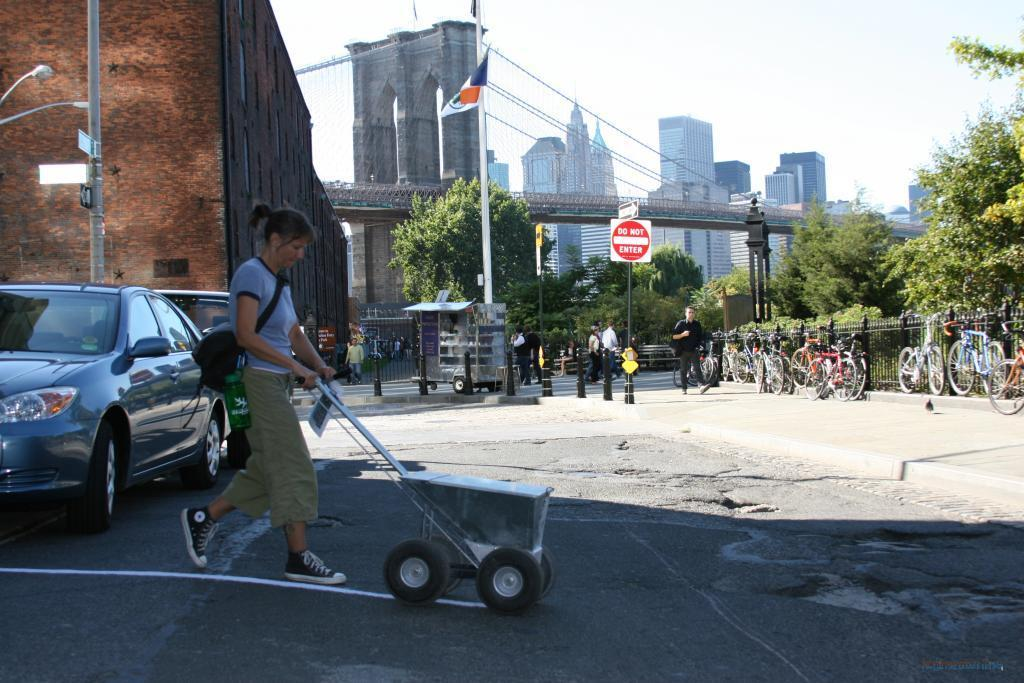
Meanwhile another artist, Eve Mosher, is tracing miles of chalk-lines on sidewalks and streets bringing to public attention the possible impact and location of a 10 foot storm surge from higher sea levels in NYC and elsewhere. See photo from her website HighWaterLine of a chalk-line being marked near Brooklyn Bridge, NYC.
And so it goes.
The scientific career of Raymond N. Johnson, Ph.D., spanned 30 years in research and development as an organic/analytical chemist; he is currently founder and director of the Institute of Climate Studies USA (www.ICSUSA.org). Climate Science is published the first Sunday of every month.