


Antarctica: A Birthday of Sorts, The Antarctic Treaty
It was on December 1 st , 1959, that the international community signed an agreement with some important principles. The treaty was signed in Washington by the twelve countries whose scientists had been active there during the International Geophysical Year of 1957 – 58. Since then, many other countries have signed on and the total is now 54.
Two principles stand out. First, that “Antarctica shall be used for peaceful purposes only,” and second, “freedom of scientific investigation … and cooperation … shall continue.”
And those principles and others added since then, have continued over the decades since.
Unlike the North Pole, which is ocean surrounded by land, the South Pole [Antarctica] is exactly the opposite. It is land surrounded by water, the Southern Ocean. And this land has an enormous amount of ice on it in the form of glaciers and snow fields.
Indeed, Antarctica is about 1.5 times the size of the United States and its’ ice sheets average about 1.2 miles in thickness. It also holds the record for the lowest measured temperature on Earth, -128.6 degrees F. Yes, that is a minus in front of the number.
So, what is the concern? Consistent with our enormous emissions of greenhouse gases, the Southern Ocean is warming just a bit, but it is causing trouble.
The density of ice is about 90% of the water it sits in, so if we see an iceberg that is about 100 feet above the waters surface, it means that about 900 feet of ice extends below the surface. So, when we have a glacier flowing into the ocean that is hundreds of feet above the water surface, it means that the ice sheet flowing into the ocean from the land sits directly on the ocean floor. And that ocean floor is not smooth. It is rough with hills, valleys, ridges and even mountains and the seaward flow of this ice sheet is slowed and held back by these irregular raised surfaces.
Until very recently, [last year or two], the research in this area was confined to the surface of the ice sheet or to bore holes drilled into the ice. Now however, uncrewed or robotic submarine studies are being made from the seafloor where the glaciers contact the sea floor.
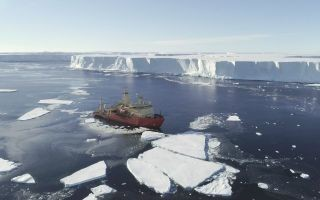
See photo [courtesy of Alex Mazur/British Antarctic Survey] of the research vessel, RV Nathaniel B. Palmer, where the scientists controlled the uncrewed submarine.
What they are finding is that the warmer ocean waters are circulating under the seaward edges of this 74,000 square mile glacier, named Thwaites, and melting it from underneath or the bottom. It is loosening it from its contact with the ocean floor. The forward portion is no longer “pinned” or anchored to the sea floor. This work was published April 9, 2022 in the journal “Scientific Advances.”
And its speed of flow into the ocean is increasing.
Hence its official name Thwaites Glacier, is now nicknamed the ”Doomsday Glacier.”
See map of Antarctica from Wikipedia. The Thwaites Glacier is in the central portion of West Antarctica and flows into the Amundson Sea on the left central portion of the map.
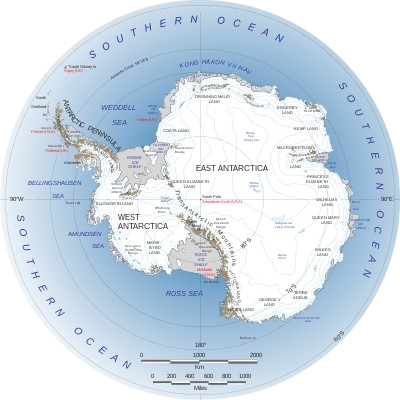
Just above this section on the map, and nearby, lies the Pine Island Glacier which is also subject to melting from the bottom by these warmer Southern Ocean waters. This work was also published recently in the journal “The Cryosphere” on March 25, 2022.
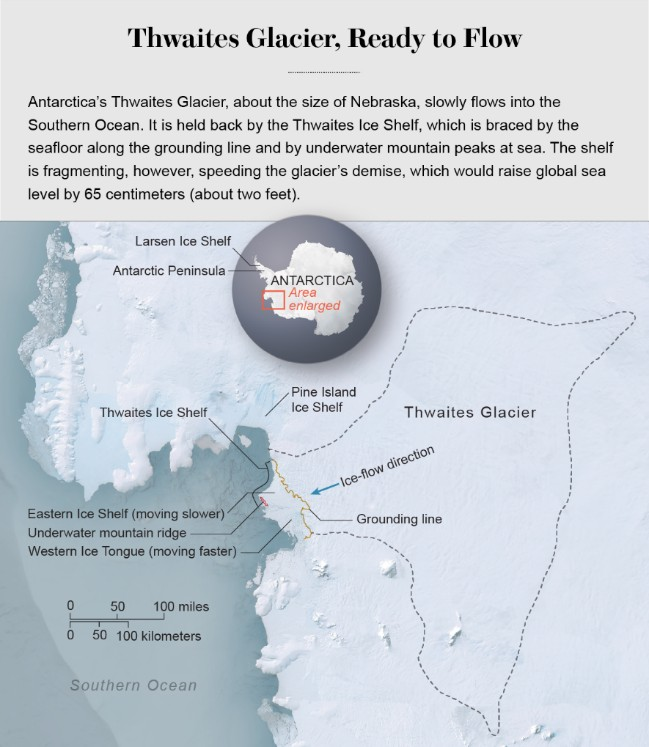
See expanded map of this part of West Antarctica showing Thwaites Glacier and the Pine Island Ice Shelf.
More work is planned and needs to be done to fully grasp the extent, speed and likelihood of this glacial melt on sea level rise. The concern is that it would be significant and could happen this century.
The World Meteorological Organization [WMO] published a provisional “State of the Global Climate Report” in November 2022 to coincide with the Climate Conference at Sharm-El-Sheikh, Egypt. In it they highlight a number of concerns such as the “the last 8 years are the warmest in the climate record”, along with a litany of heatwaves, drought, melting glaciers and also, rising sea levels.
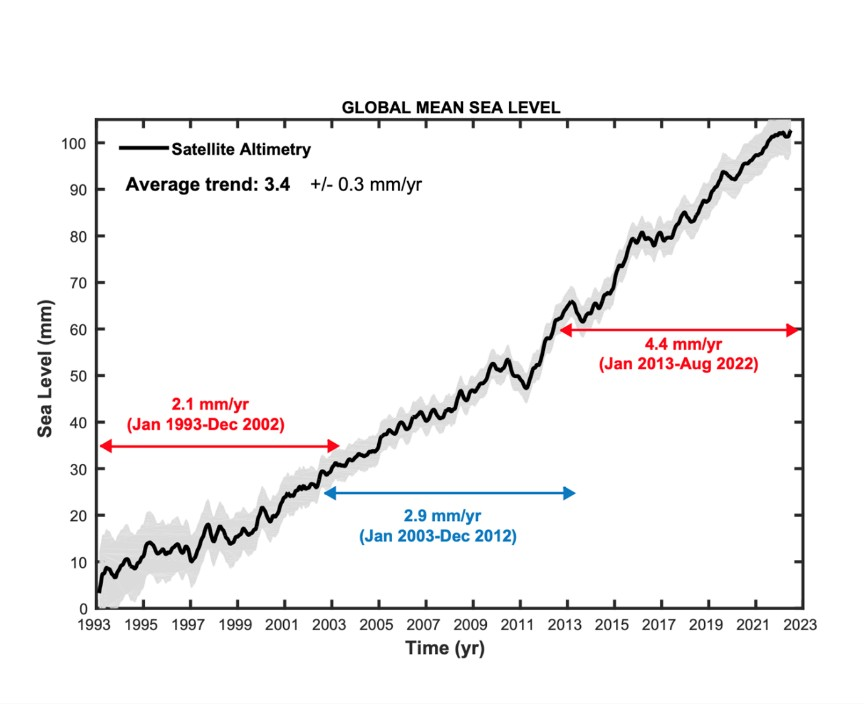
See graph, labeled on top, “Global Mean Sea Level,” with the left side axis labeled, “Sea Level [mm]” from this WMO report. The time in years is along the bottom portion of this graph. It shows that the rate of sea level rise has increased significantly in each of the last three decades. It has more than doubled from the Jan 1993-Dec 2002 rate of 2.1 millimeters [mm] per year, to 4.4 mm per year for the Jan 2013-Aug 2022 period.
Not good. If the current research findings are confirmed, this rate of sea level rise will continue and cause severe problems in coastal areas globally.
Let’s briefly look at the other side of the climate ledger. The positive side.
The 2021 Inflationary Reduction Act [IRA] has electric vehicle charger stations incorporated into it. The Act will enable the installation of 500,000 chargers in all 50 states and plans for all states have been approved. The goal is to have a charging station every 50 miles on all major highways. This will significantly reduce fossil fuel consumption and associated carbon emissions.
In 2022 through July, 71% of all new U.S. power generation was comprised of solar and wind. This will also reduce carbon emissions.
The climate accountants have their hands full trying to balance these books.
And so it goes …
The scientific career of Raymond N. Johnson, Ph.D., spanned 30 years in research and development as an organic/analytical chemist. He is currently founder and director of the Institute of Climate Studies USA (www.ICSUSA.org). Climate Science is published monthly.