


Geologists Say We Are in the Holocene Epoch; Others Call it “Anthropocene,” Some, “Pyrocene”
Let us review a recent “climate” event we all shared to some degree. It illustrated the urgency of many climate scientists and some policy makers for the need to take faster and stronger action on reducing carbon emissions.
Experts agree that significantly hotter temperatures and severe drought enabled more than 10 million acres of this northern [boreal] forest in Quebec, Canada to burn. It was a wildfire. Then, the counterclockwise rotation of the weather system brought to the U.S. the smell of smoke … and haze consisting of tiny particles … lots of them.
In early June New York City had the worst air quality in the world! That includes Delhi, Beijing and all other cities normally viewed as having polluted air. Approximately 80 - 100 million Americans were living under a “Red” air quality alert. The air was considered dangerous to breathe for people with asthma, pulmonary [lung] and heart conditions.
Then other cities later in June: Ottawa, Montreal, Detroit, Chicago, Louisville, and many others joined in with air quality ratings in the “unhealthy” zone. The culprit is the ultra-small particles, in this case produced from forest fires [wildfires] and labeled PM2.5. Particles this small, with adsorbed potentially toxic organic compounds, can enter the blood stream through the lungs and circulate throughout the body.
For days, the North Country had haze that limited visibility and one could smell the smoke from these wildfires.
Inhabitants were urged to limit exercise and stay indoors if possible.
The photo here of a cell phone app [free] titled, AirNow.gov, shows a reading of 154 [in Chazy] on July 1, 2023. It is considered “Unhealthy.” Earlier in the week this app from the EPA [Environmental Protection Agency] had values as high as 400 for Detroit and other places in North America. NOTE: We are talking about most of the continent now.
Though slow to start, the state of Michigan has now stepped up to the plate with perhaps the most ambitious carbon emissions reduction plan in the U.S., if not the world. With control of both chambers, Governor Gretchen Witmer’s recently developed climate plan includes the generation of all its electricity from solar, wind or other carbon-free sources by 2035. Coal, which currently generates more than half of the state’s electricity, would be phased out by 2030.
The reasons are many for this initiative but here are a few. Michigan is experiencing toxic algal blooms, and higher temperatures are causing the cherry trees to bloom too early. Then a late freeze damages the season’s major cherry crop. A recent extreme precipitation event flooded basements and stranded drivers in Detroit. The six inches of rain that fell in 24 hours is more than twice the amount the area would normally get in a whole month.
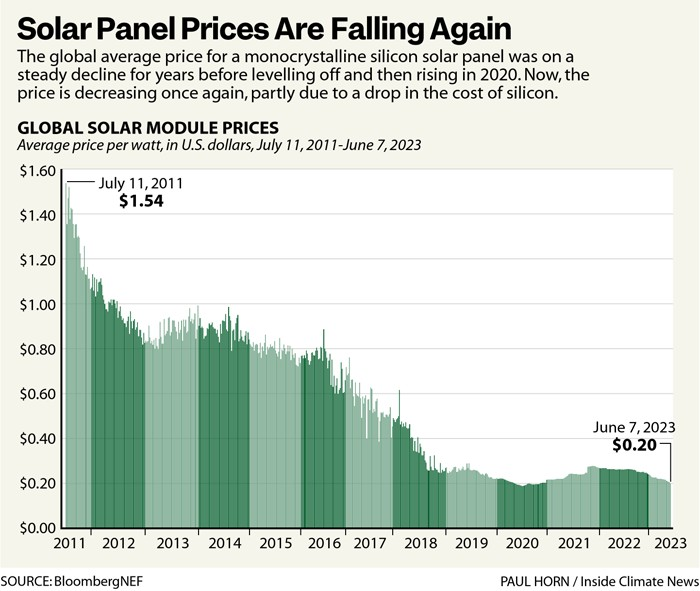
And, the timing of this energy transition is good. After supply chain issues and slow deliveries of photovoltaic [PV] panels in 2021 and 2022, the kinks in the manufacturing and delivery segments appear to have been worked out. Supplies are increasing and the prices are falling again.
See the graph, “Solar Panel Prices Are Falling Again.” Note that on June 7, 2023, the Global Solar Module average price per watt was $0.20. This is over 7 times less than 12 years ago when the cost was $1.54 per watt.
And … according to the Solar Energy Industries Association, the industry’s recent first quarter was the best ever installing 6.1 gigawatts of PV which is enough capacity to power more than one million homes.
This reduction in solar modules/panel costs, and initiatives underway such as with Gov. Witmer in Michigan, are among many efforts underway in various segments of business, society and industry to reduce consumption of fossil fuels; this includes battery storage technologies, off-shore wind turbines, on-shore wind turbines, geothermal, and nuclear.
The race we are in with our changing climate is ramping up and is illustrated by some recent measurements that are of serious concern.
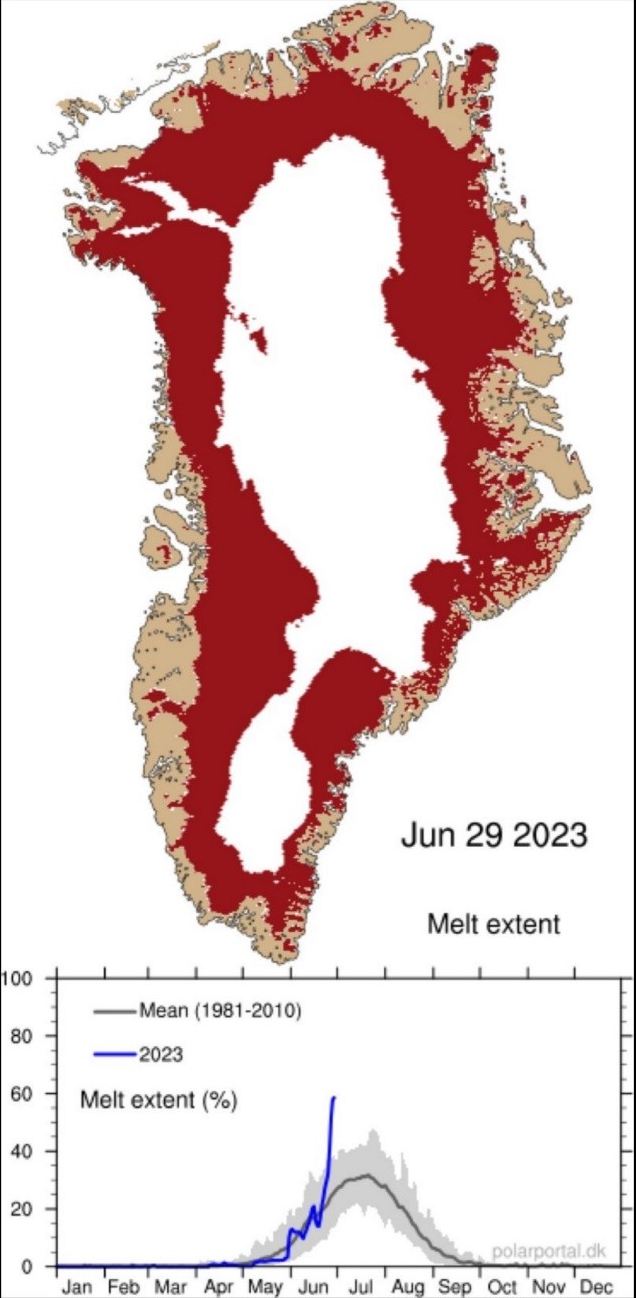
One of these shows the large island, Greenland, with a title “Jun 29 2023, Melt extent.” Its enormous glacier that measures up to 2 miles thick, at the center of the island, is melting at an accelerating rate this year. See at the bottom of this image a curve with three components. The dark central line of the curve starting “May” and extending through “Sep” shows the mean melt rate for the 1981 – 2010 period, and a lighter area on either side of the mean showing the range of values over those decades. Then note the sharply rising almost vertical dark line starting in June which reflects the melting for 2023. It is far, far outside the norm; implication of course, is for accelerating the sea level rise.
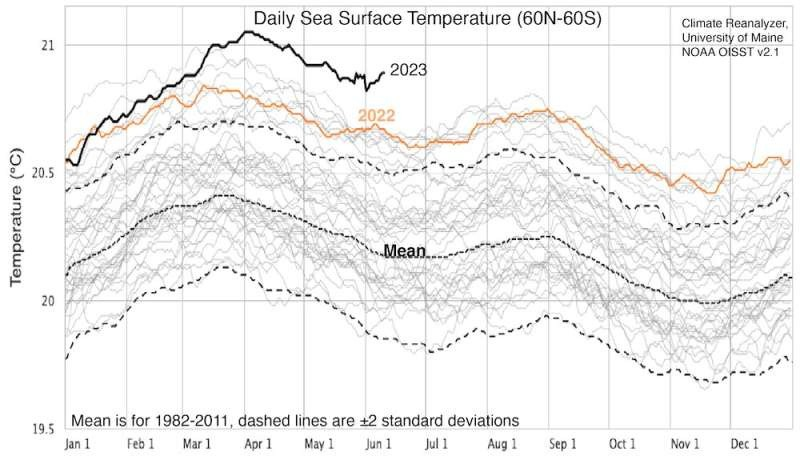
Please also see the graph titled “Daily Sea Surface Temperature (60N-60S).” This was provided by Climate Reanalyzer, University of Maine, NOAA OSST v2.1.” It is abusy curve with lots of data but the takeaway message here is the ocean temperature for 2023 is at an all time high [see top dark line that extends to mid-June 2023].
This enormous amount of stored energy has significant implications for our weather. Ocean “heat” is a driver for strong tropical storms, hurricanes and other extreme weather events.
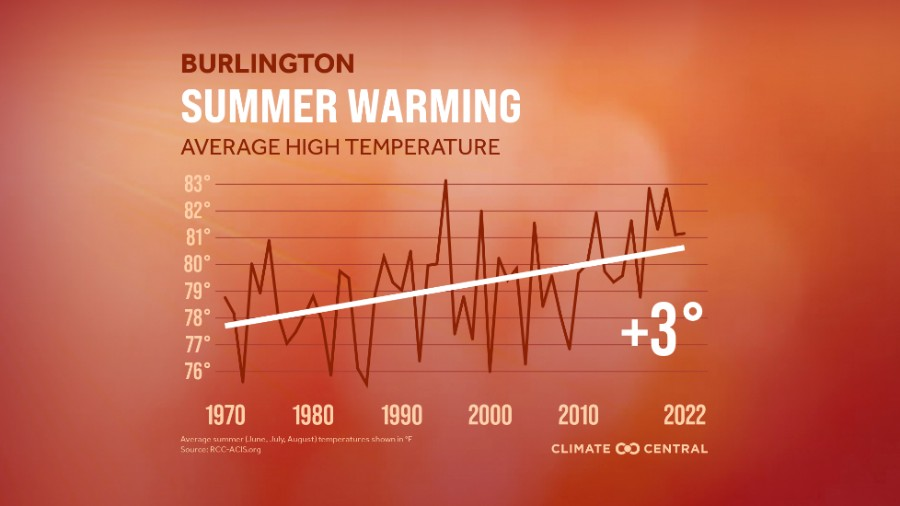
And then again, we have more local climate changes to contend with. See the temperature [vertical axis] and annual time chart [horizontal] labeled “Burlington SUMMER WARMING”, VT over the past 50 years. The average high temperature has increased by +3 degrees Fahrenheit during this interval.
We all have a lot of work to do to reduce our carbon emissions.
And so it goes.
The scientific career of Raymond N. Johnson, Ph.D., spanned 30 years in research and development as an organic/analytical chemist. He is currently founder and director of the Institute of Climate Studies USA (www.ICSUSA.org). Climate Science is published monthly.