Dead Trees Can Talk to Us, in a Way; Our National Electrical Grid
Scientists are curious creatures and will go to great lengths to try and get answers to questions. In this case there is an interest in knowing what the climate has been like in the past. Our instrumental records only go back less than 2 centuries [about 1850], so what were the temperatures like 2,000 years ago? Or perhaps 1,000 years ago?
A recent peer reviewed paper in the journal Nature examined one way to try and understand what temperatures and climate variability was like before the instrumental record was available. The lead author of the paper is Jan Esper, a climatologist at Johannes Gutenberg University in Mainz, Germany. In an ambitious study involving a dozen research groups, the scientists analyzed some 12,000 trees from across the Northern Hemisphere. The cores taken were from live trees, dead trees and historical wood samples from museums and archeological sites.
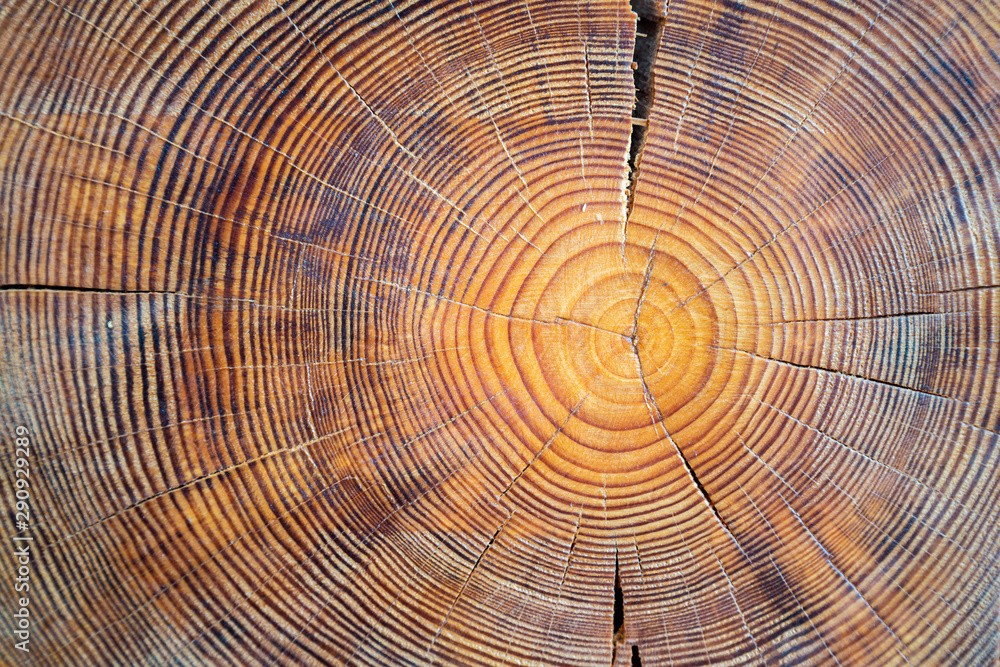
Trees grow every year, and the growth is reflected in the width of the rings. The lighter part of the ring is from spring and summer, while the dark edge portion is from late summer and fall growth. One light and dark ring represents one year in the life of a tree. A lot of work is needed to convert these ring widths into a meaningful temperature measurement.
See the free photo from CrispyMedia that illustrates these rings. Note the different widths of the rings as one moves from the youngest wood at the center toward the outside which is the older wood. The larger cracks seen at the top and bottom of the image are from drying of the wood with time.
The results of the study indicate that the summer of 2023 was the hottest in 2,000 years [NYTimes 15 May 2024].
The National Electrical Grid
The summer of 2024 is also forecast to be hot as well. This will put stress on the electrical grid that carries electrons from where the energy is produced to where it is needed. And our consumption of electricity is increasing from several factors. Even though more than 30% of the world’s electricity now comes from renewables, demand is increasing. Data centers are growing to meet the needs of AI [artificial intelligence], crypto-mining, more air-conditioners to stave off bigger heat waves, EV’s [electric vehicles], industrial production and more.
See the map of the U.S. from Climate Central showing the amount of increased warming in the various states where some states are warming faster than others. Some areas of the country are up to 4 degrees Fahrenheit [F] warmer since 1970 while two states show a lesser increase of 1.5 degrees F.
Technology available now, right now, could significantly increase the amount of electricity that the U.S. grid can handle [CleanTechnica, April 10, 2024, Steve Hanley.] Our power grid needs to be modernized not only with new transmission lines but with new cables. The design of the cables used today has been around for a century. They need to be replaced.
This newer cable design widely used by a number of countries is called “advanced reconductoring.” Simply replacing the older cables with this new type would eliminate the delays of the permitting logjam, reduce community opposition, and reduce the need and expense of big transmission lines. These new cables could double the capacity of the HVDC [high voltage direct current] the U.S. grid could carry.
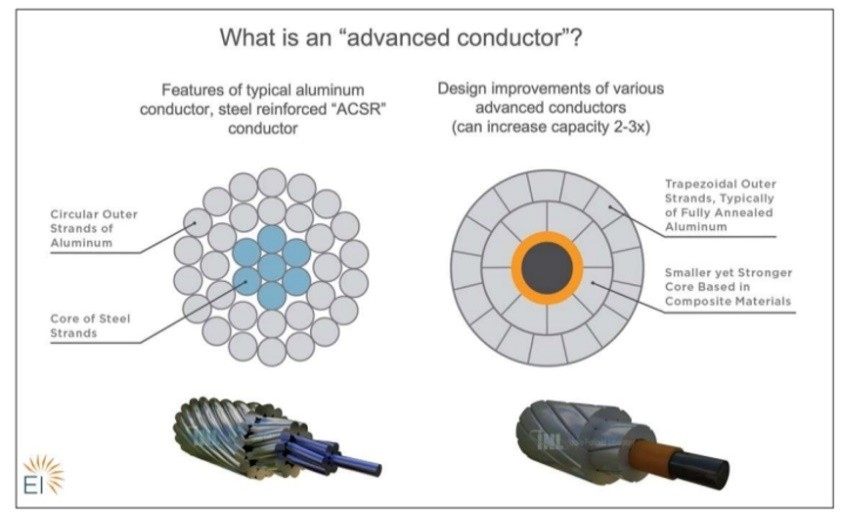
See the illustration, “What is an “advanced conductor”?
The illustration [Image credit; Gridlab] shows two cables: on the left is the old version showing a core of steel strands with circular outer strands of aluminum. A significant amount of empty space can be seen. On the right is the newer improved design. Lighter and stronger composite materials make up the core, surrounded by trapezoidal outer strands of aluminum. Note the reduction of empty space in the new design with a capacity increase by a factor of 2-3x.
According to “Utility Dive” replacing the old lines with advanced conductors usually costs half as much as building new lines partially because it uses existing infrastructure. According to Amol Phadke, a senior scientist at Berkeley who told the NYTimes, “We were pretty astonished by how big an increase in capacity you can get by reconductoring.”
Hardening the grid from severe weather events should also be part of this modernization.
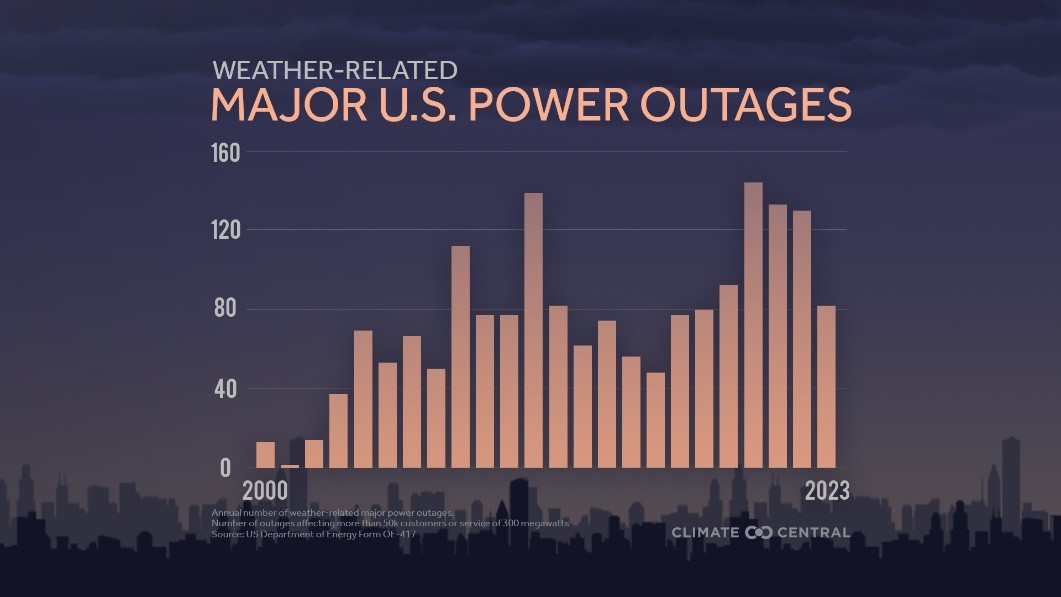
See the two bar charts: first one is titled “Major U.S. Power Outages, Weather Related, 2000 - 2023” developed by Climate Central with information from the Department of Energy. It clearly shows that severe weather is causing more than half of the outages.
Note the second bar chart from the same source titled “Weather-Related Major U.S. Power Outages” with the same period of 2000 – 2023. It clearly shows an increase in Outages in recent years.
And, so it goes.
The scientific career of Raymond N. Johnson, Ph.D., spanned 30 years in research and development as an organic/analytical chemist. He is currently founder and director of the Institute of Climate Studies USA (www.ICSUSA.org). Climate Science is published monthly.


