


Solar: Reducing Carbon Emissions from Transportation and Power Generation
Let’s take a look, way, way back, into our high school science classes and talk about the “elements.” And these elements are not snow, rain, hail, wind, or other experiences with the weather we may have had. The “elements” referred to here are those basic building blocks that make up everything we see on our planet, Earth.
See the illustration titled “Periodic Table of the Elements,” from Periodic Table Wallpapers.
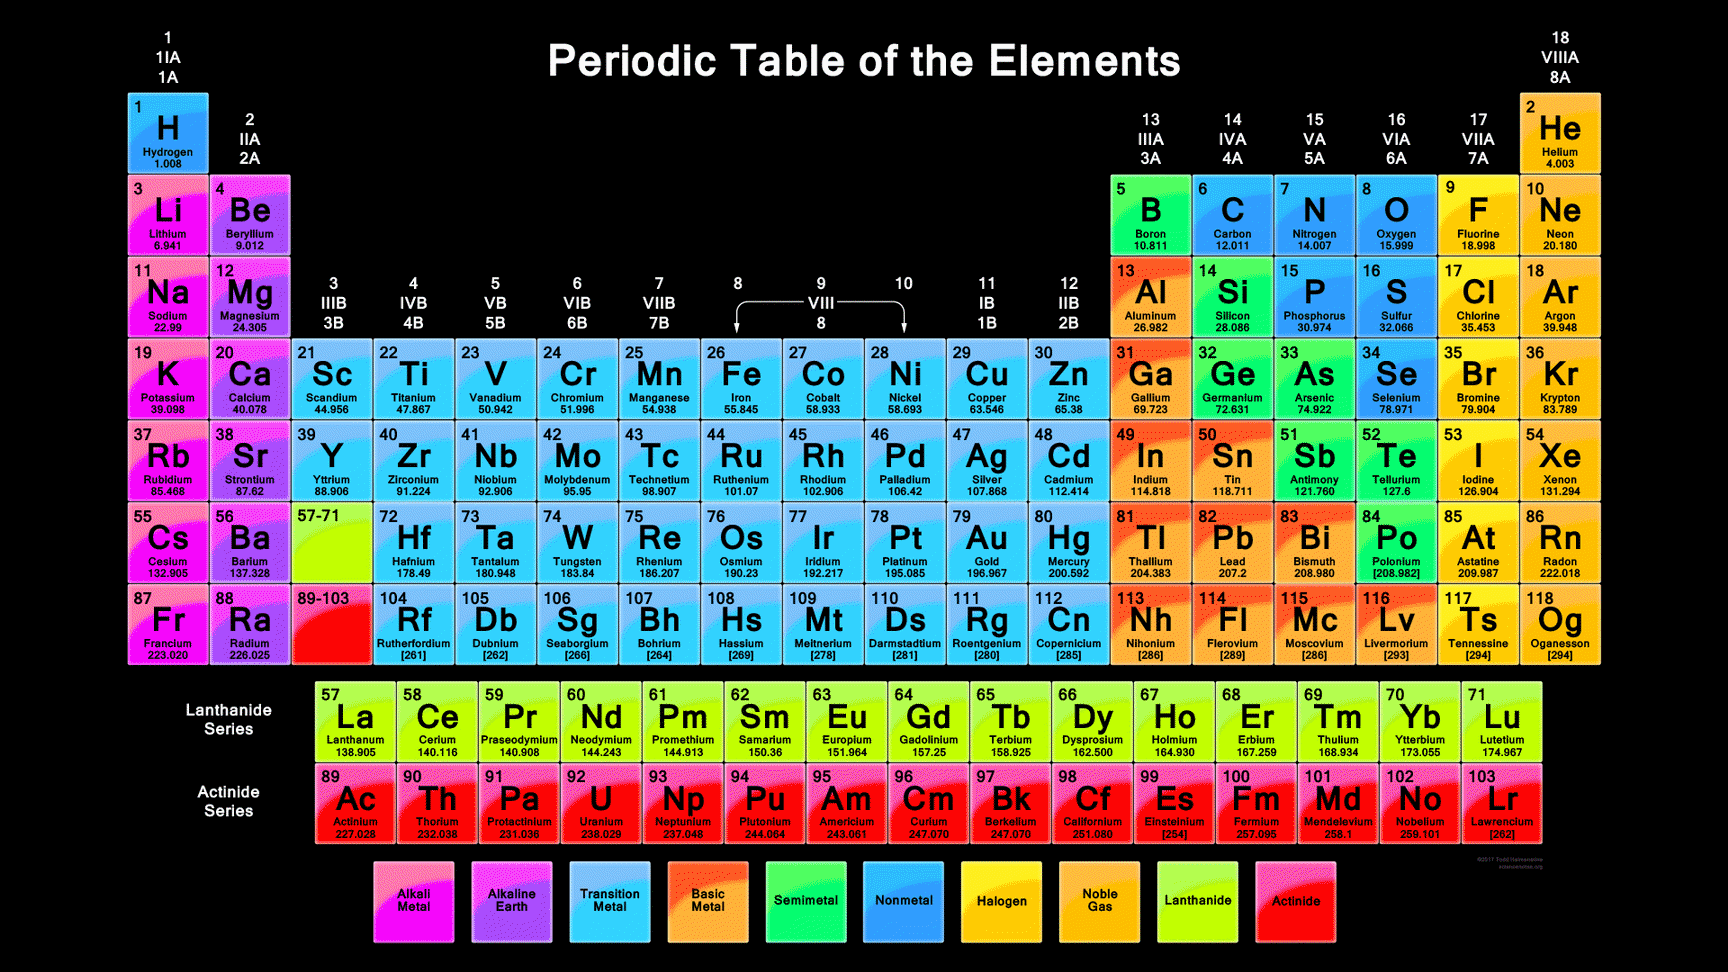
The early version of the Periodic Table was developed by a Russian chemist named Dimitri Mendeleev in 1869. He attempted to group Earth’s elements into patterns which accounted for the properties of those elements. This included their solubility in water, reactivity, or lack thereof, compared with other elements. It now includes the number of protons and neutrons in the nucleus along with other physical properties. It could even be used to predict that some elements were missing that had not yet been isolated.
There are 92 elements in the Table [U or Uranium is number 92] that occur naturally, and then there are a dozen or so short lived synthetic elements made in powerful reactors and/or chambers.
In our discussion of solar however, we need to focus on several of the lighter elements. Note in the Table, in the second row across, and just below hydrogen [H], is the element lithium [Li]. This is the major storage element in electric vehicle [EV] batteries.
Several other elements are critical for the cathodes and anodes in the EV battery and include manganese [Mn], iron [Fe], cobalt [Co], and nickel [Ni]. These are all found in the center of the fourth row across. All together these elements, andperhaps others, will play a big role in our shift from internal combustion engines [ICE] to batteries and electric vehicles [EV]. These elements have the properties that enable EV batteries to store, use, and re-charge the electrical energy they contain, over and over again.
The inflationary Reduction Act [IRA] of 2022 was passed just in time. China has a decade head start in this EV future and 54% of all electric cars are made in China. They have developed sophisticated refining, processing, and manufacturing capabilities that make them world leaders in this area. The funding in the IRA will help jump start our research, development, and manufacture of batteries as we move into a reduced carbon-emissions future.
TRANSPORTATION
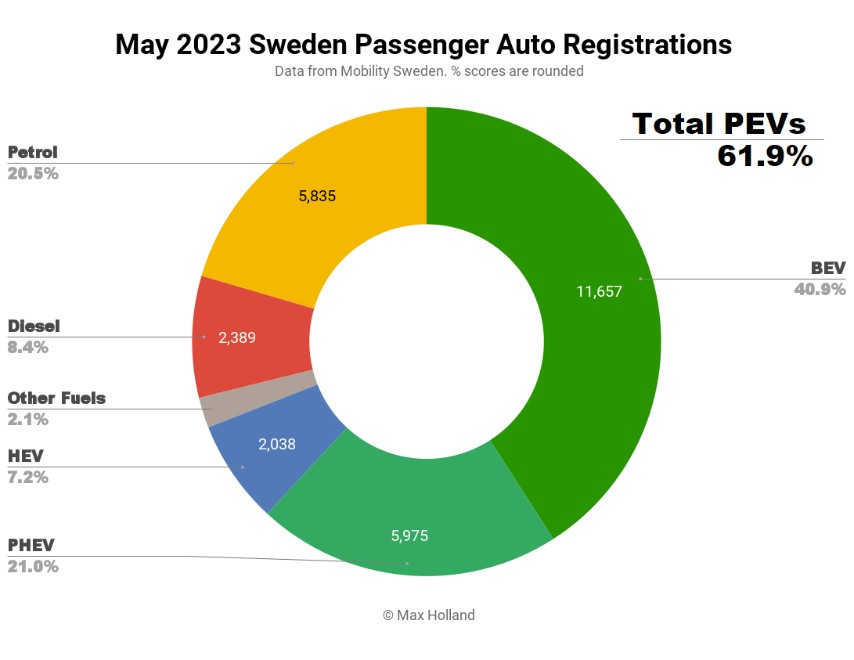
This battery technology is helping the Nordic countries to move quickly to electrify their transportation sector. Note the circular chart labeled “May 2023 Sweden Passenger Auto Registrations.” In May 2023, 61.9% of all new car registrations were plug-in electric vehicles [PEVs]. Of this amount 40.9% were full BEV [battery only electric vehicles], and 21.0% were PHEV [plug-in hybrid electric vehicles]
Norway, Denmark, and Finland are all on a similar trajectory. Other European countries are somewhat below these numbers but the U.S. now has a target of no more sales of new internal combustion engine cars starting in 2035. We have a lot of work, and investment, that needs to be done.
It is understood by all governments that we must reduce our carbon emissions and our dependence on fossil fuels with the immediate focus on [1]transportation, and [2]electricity generation, the two largest sources of carbon dioxide emissions.
POWER GENERATION – RENEWABLES, SOLAR
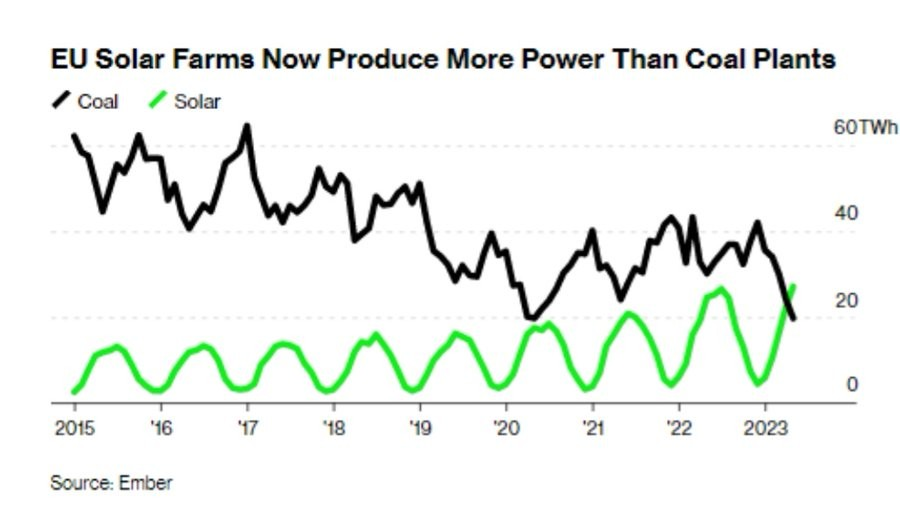
The combustion of fossil fuels still accounts for most of the electrical energy the world uses but renewables are growing rapidly. See the graph labeled, “EU Solar Farms Now Produce More Power Than Coal Plants.”
For the first time “the EU transition to clean energy hit a milestone in May, solar panels generated more electricity than all of the bloc’s coal plants for the first time.” The graph [by EMBER] from a recent article in Bloomberg New Energy Finance [BNEF] shows the two lines converging with solar [the orange wavy line] ahead of coal [the black curvy line.] The declining amount of coal power over the past 8 years and the growing contribution of solar is a significant milestone. The generated amount of solar power of ~26 TWh [TeraWatthours] is enormous.
The global renewable energy generation progress is growing as well. Please note the vertical bar chart labeled, “Cumulative PV Deployment – 2022 (1,233GWdc).” This amount of power that can be generated by photovoltaics [PV], in gigawatts [GW], is significant and will have an impact of emissions of CO2.
The leader by far in Cumulative PV deployment is China [462 GW], more than 3X that deployed in the U.S. [142 GW]. This data is from the U.S. National Renewable Energy Laboratory [NREL], and as we can see, many countries have begun this clean energy transition as is noted here.
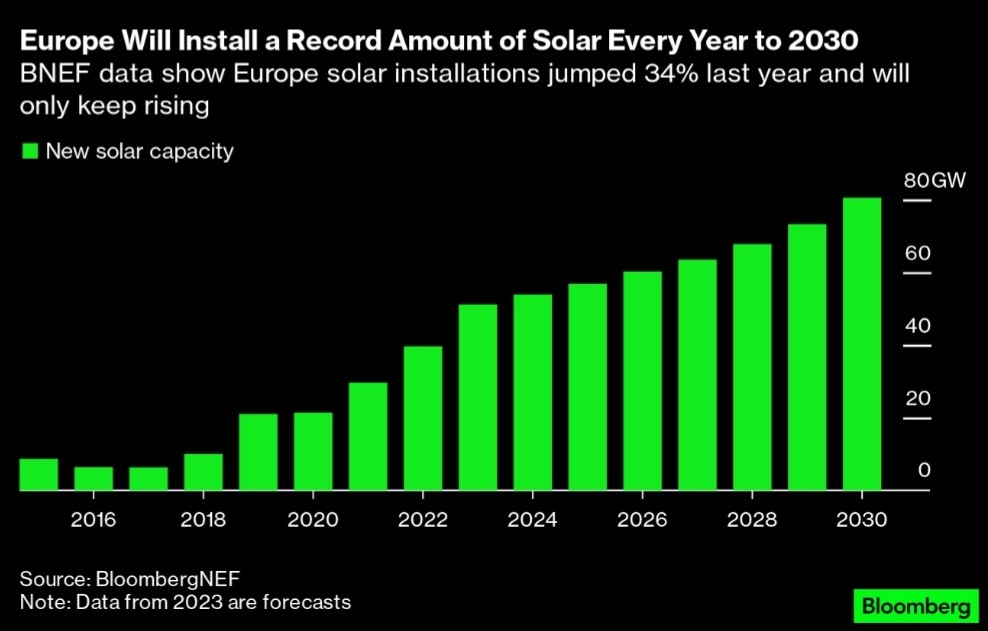
But the future efforts in Europe and elsewhere are projected to be strong. See the bar chart titled, “Europe Will Install a Record Amount of Solar Every Year to 2030.”
“Never before have we had so little time in which to do so much! Author: Franklin
And so it goes.
The scientific career of Raymond N. Johnson, Ph.D., spanned 30 years in research and development as an organic/analytical chemist. He is currently founder and director of the Institute of Climate Studies USA (www.ICSUSA.org). Climate Science is published monthly.