


“Let’s Do the Numbers,” For Earth’s Climate That Is
As one financial analyst says regularly on NPR, “Let’s do the numbers.” And by numbers here, it is not meant to be the S&P 500 or the latest interest rates. It has to do with Earth’s climate and what has happened over the past year and the prior decades.
We may remember that Dr. James Hansen, at the Goddard Institute of Space Studies [GISS], testified in Congress in 1988 that a signal had been detected that humans were having an impact on the climate. Even in his retirement he has continued to study and publish data on this topic.
[Note: In 2006, Dr. Hansen was designated by Time Magazine as one of the 100 most influential people on Earth.]!!
One set of numbers is in the curve labeled “Fig.1. Global Temperature relative to 1880-1920 based on the GISS analysis” and gives the Annual Mean temperature changes over the past 143 years. The inexorable rise of the curve from the 1980’s on, culminates at the far-right side with the point for 2023 almost off the top of the graph. This graph was published in a paper on January 12, 2023; the authors are James Hansen, Makiko Sato, Reto Ruedy.
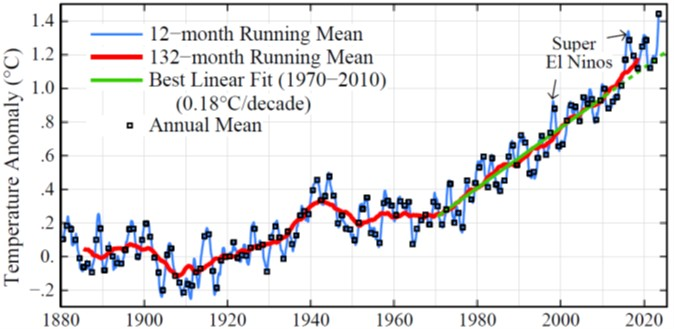
Fig. 1. Global temperature relative to 1880-1920 based on the GISS analysis.[1],[2]
The abstract for the paper goes on to say, “Record global temperature helps reveal acceleration of global warming on decadal time scales.” It goes on to say, “We expect record monthly temperatures to continue into mid-2024 due to the large planetary energy imbalance …” The full paper can be found on his website; Dr. James Hansen, Earth Institute, Columbia University.
On page 1 of The New York Times, December 29, 2023, a graph virtually identical to the Hansen graph here was provided by NOAA [National Oceanographic and Atmospheric Administration]. It was published with a lengthy discussion of the implications of this trend for our climate system and what we might expect in the future.
Similar data and conclusions on global temperature increases in 2023 were also published by WMO [World Meteorological Organization], and Berkeley Earth, a California-based non-profit research organization. They all agree that 2023 was the warmest year on record.
Another “Let’s do the numbers” fact is that we can expect more climate disasters to occur. See the map titled “U.S. 2023 Billion-Dollar Weather and Climate Disasters.”
Quoting from NOAA and The National Centers for Environmental Information, “In 2023, there were 28 confirmed weather/climate disaster events with losses exceeding $1 billion each to affect the United States. These events included 1 drought event, 4 flooding events, 19 severe storm events, 2 tropical cyclone events, 1 wildfire event, and 1 winter storm event.
Overall, these events resulted in the deaths of 492 people and had significant economic effects on the areas impacted. The 1980–2023 annual average is 8.5 events CPI [Consumer Price Index] adjusted); the annual average for the most recent 5 years (2019–2023) is 20.4 events (CPI-adjusted).”
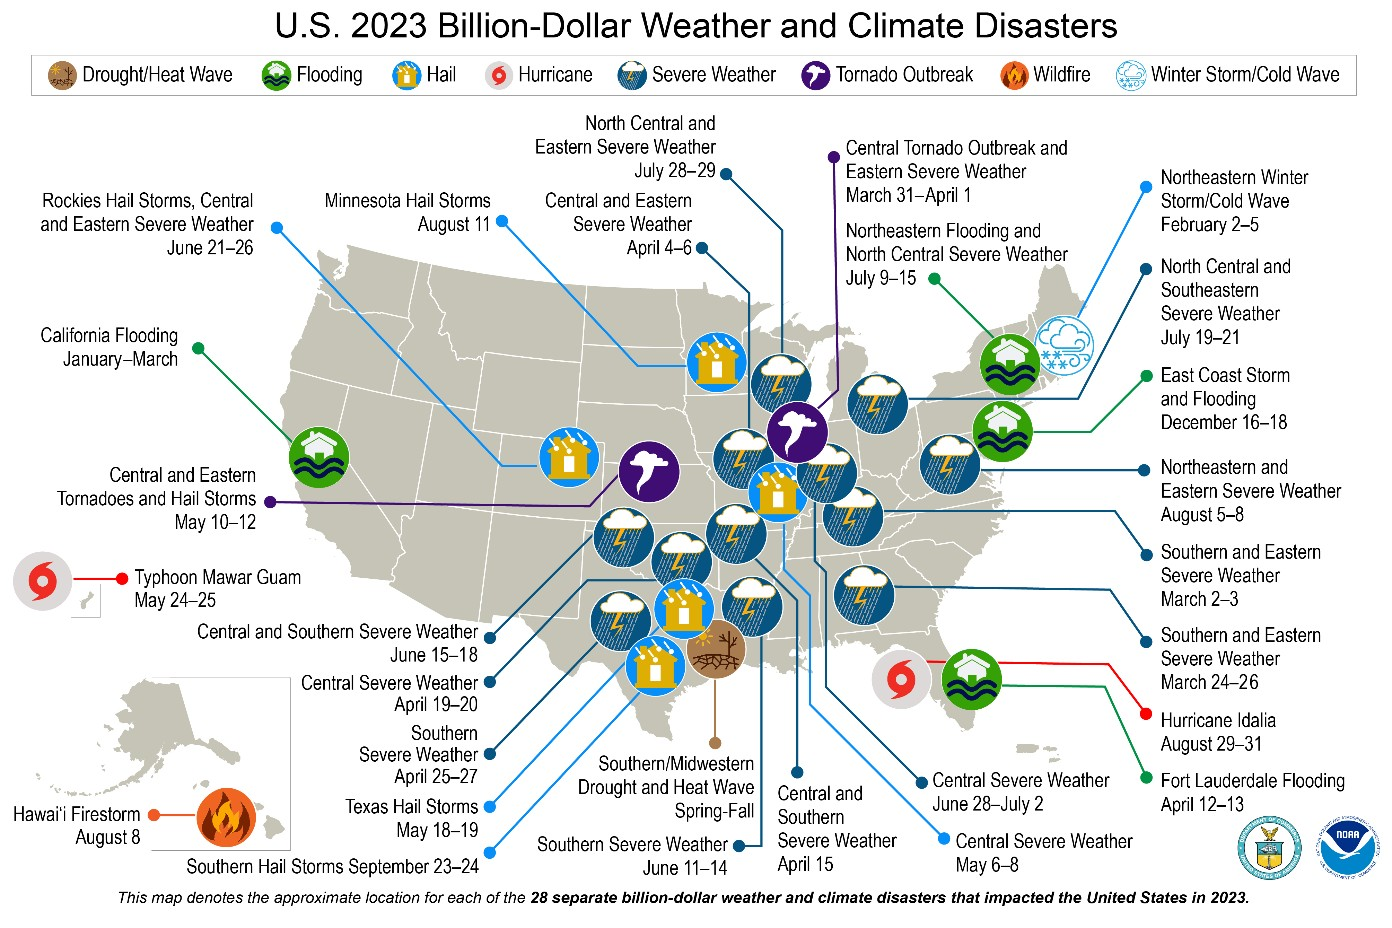
Who is paying for these disasters? The long and short of it is, you and me, all of us. The financial toll has been enormous. According to NOAA the damages totaled at least $92.9 billion in 2023.
Articles by Bill McKibben, the Wall Street Journal, NYTimes and more discuss the impact of these costs and where and how they are being borne. In some areas insurance is no longer available, or the costs for many have risen to a level that is not affordable.In other cases, the costs are built into the products we buy, like lettuce for instance, so in effect we are all paying more to cover the damage from these climate related disasters.
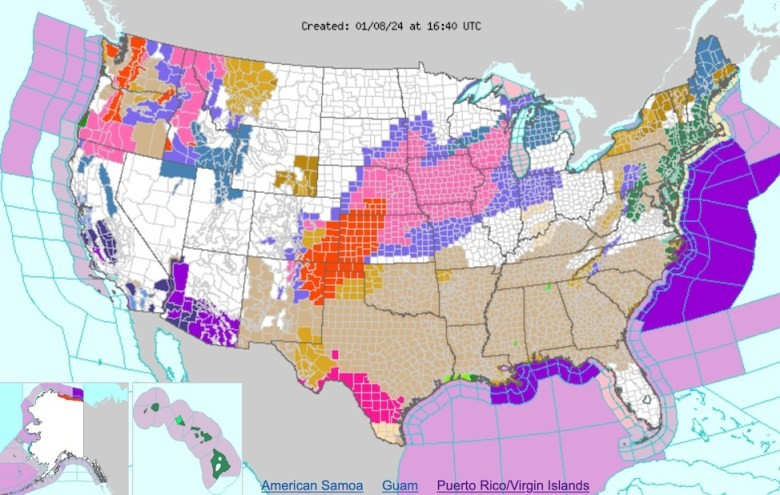
Another map here provided by the NWS [National Weather Service] is also labeled “Figure 1. All-hazard map from the National Weather Service issued at 11.40 EST Monday, January 8, 2024.”
When this was issued the staff at NWS were surprised by how many storm alert events were forecast for the coming days. Maps with this complexity were not seen until very recently. The maps show some of the 30-odd weather events that are forecast for the period including “Blizzard Warning”, “Ice-Storm Warning”, “Freeze Warning,” and many, many more. The website “National Weather Service, NOAA” is an excellent source of weather information.
While we, as a people, in the U.S. and internationally, grapple with the carbon dioxide emission problem, the primary greenhouse gas causing global climate change and the climate weirding we are experiencing, some positive actions are being taken by schools around the country.
See the vertical bar chart labeled “Committed Electric School Buses in the U.S. March 2022 – June 2023.” The data show that in a span of less than 1 ½ years, the number of electric school buses in the U.S. has increased by about a factor of 2 ½ times. As of June 2023, the number was almost 6,000 school buses on the road or ordered.
Any parent who has traveled in one of the older diesel bus types knows the smell that accompanies them. The new emission-free buses are much healthier for the students and bus drivers as well. While the initial cost is considerably higher, the maintenance and fuel costs are much lower and will result in savings in the longer run.
Some of the school districts are using the equivalent of a carport for buses [a bus port] that have solar panels on the roof. The goal of these schools is to generate some or all their electric power as well as forego the use of fossil fuels entirely. See photo.
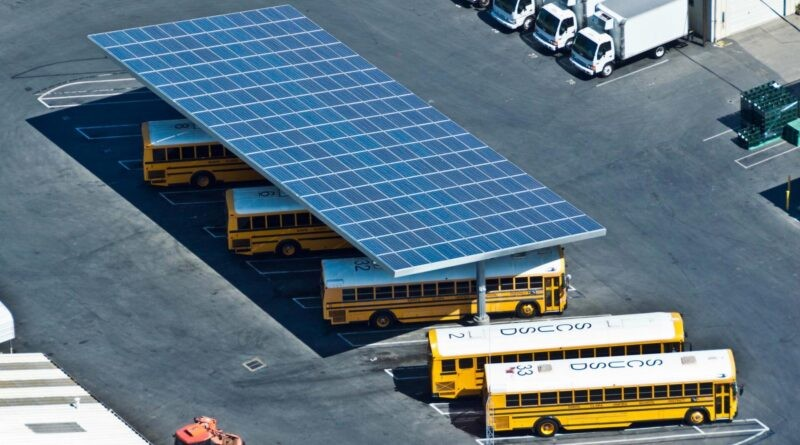
The image of the bus port is from Sacramento City Unified School District, via SEIA.
And so it goes . . . .
The scientific career of Raymond N. Johnson, Ph.D., spanned 30 years in research and development as an organic/analytical chemist. He is currently founder and director of the Institute of Climate Studies USA (www.ICSUSA.org). Climate Science is published monthly.