


In Time?: Globally, The World Invested $1.1 Trillion in 2022 on Renewables
More and more discussion, research, financial reports and information of all stripes, are surfacing continuously, concerning our understanding of Earth’s climate as well as the energy transition that is happening right now. This energy transition is critical in order to reduce carbon emissions from fossil fuels and their impact on climate.
Take for example a new report, “New Energy Outlook” by the respected firm of BloombergNEF [New Energy Finance: January 10, 2023]. It discusses geopolitical risks, energy disruption, the war in Ukraine and more, and the fact that the IPCC [Intergovernmental Panel on Climate Change] over the past several years has ramped up goals to reduce carbon emissions. Part of its take away message is, ”The outlook for low-carbon transition continues to look extremely bright” and they “expect clean power additions to increase by at least 18% in 2023...”
The report goes on to state that “... if 2023 marks the start of a new era in the low-carbon transition, it won’t be an era characterized by any sort of slowdown.” The global dynamics are too strong: energy security is a premium, low-cost renewables are less expensive to build and operate than any other source of power, and more capital is being made available for developing economies among other initiatives.
Rocky Mountain Institute [RMI] is a research institute focused on climate, energy and other issues of our times. L:ocated in the U.S. their work supports the findings of BloombergNEF. See their chart labeled “Electricity generation TWh.” The TWh stands for terawatt hours which is an enormous amount of electricity.
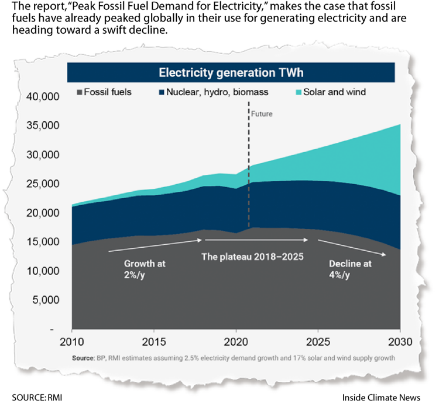
Let’s put TWh into perspective: our homeowner electric bills come to us in units of kilowatt hours [kWh], and a typical family’s average monthly consumption is about 600 to 1200 kWh. But, one TWh is one billion kWh or 1,000,000,000 kWh. Indeed!
In this RMI chart we see three color-coded curves: they are labeled “Fossil fuels”, “Nuclear, hydro, biomass”, and “Solar and wind.” The bottom “Fossil fuels” horizontal curve shows a power generation plateau in the years 2018 – 2025, followed by a decline of 4%/year.
The middle curve for “Nuclear, hydro, biomass” also shows a similar power generation plateau and extending a bit longer past 2025. But notice the top curve for “Solar and wind”. It shows very strong current and future growth and displacing or replacing the energy generation from the first two.
The challenge, per BNEF, is to expand this renewable energy investment of $1.1 trillion in 2022, [it was $0.75 trillion in 2021] to over $4.5 trillion per year in less than a decade. Decisions by financial institutions, additional government policies such as the landmark Inflation Reduction Act, personal investments, individual choices, and more, will all be needed.
The graph titled “CARBON’S CONTINUED CLIMB” illustrates the problem. In 2020, COVID-19 caused a strong dip in this carbon dioxide curve of ever-increasing emissions. The trend looked very promising but, alas, as 2021 shows it did not last. Now it appears to be almost leveling off in 2022, with a downturn hopefully happening soon.
The year 2022 was marked by a number of severe weather events including heat waves. See bar chart labeled “10 HOTTEST GLOBAL YEARS ON RECORD’” from Climate Central. Indeed, 2022 was the 6th hottest year on record and all 10 of the hottest years have occurred since 2010.
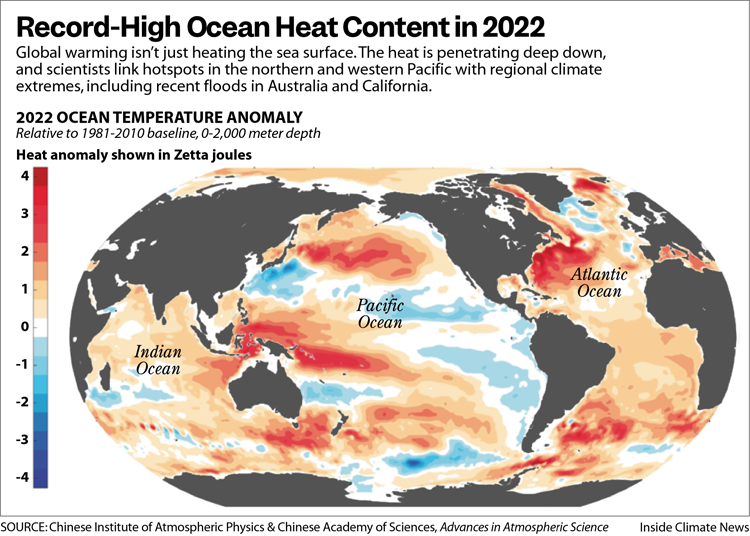
And we cannot forget about the oceans which cover some 78% of Earth’s surface. See global map titled “Record-High Ocean Heat Content in 2022.” The thermal information and map was published recently by the Chinese Institute of Atmospheric Physics and Chinese Academy of Sciences. The darker shades of large parts of the oceans reflects significant heating down to a depth of over 6,600 feet. These measurements are relative to the baseline years 1981 – 2010.
The short and long-term impacts of all this stored “energy” is not fully known but it will definitely influence our weather for decades, or longer, to come.
It is not only scientists, engineers, writers, policy makers and more, that try to spread awareness of climate change: it also includes many artists.
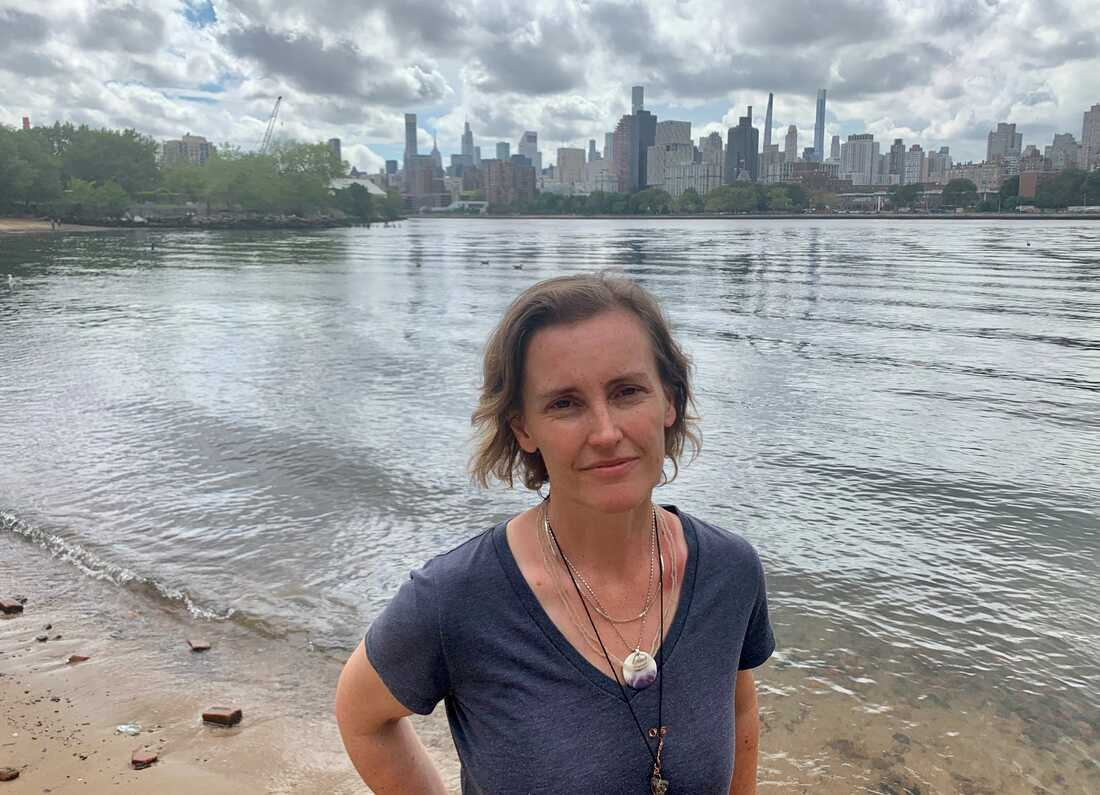
One of these is a woman named Sarah Cameron Sunde. See photo of Ms. Sunde: Matthew Schueman/NPR. Sitting by the ocean while visiting Maine she watched as a rock nearby slowly disappeared as the tide came in. This triggered an idea that could be used to bring to the publics’ awareness: sea level rise. This observation was a metaphor for the way in which climate change will change our shorelines, and our lives.
So, she developed a “durational performance,” one that lasts about 13 hours. The process involves Ms. Sunde walking into the water at low tide to a point where at high tide the water will be up to her neck. She remains there as the tide comes in and until the high tide goes out again and completes the tidal cycle. The public, swimmers, and waders can join her for any length of time and participate and many do.
There is a YouTube series on her “stands” as she has done this on different continents in 9 different parts of the world. The most recent event was in NYC along the East River in September 2022. The videos are most interesting to watch, and no, they are not all 13 hours long.
And so it goes ... .
And then we have: “Live in each season as it passes; breathe the air, drink the drink, taste the fruit, and resign yourself to the influence of the Earth.” — Henry David Thoreau
The scientific career of Raymond N. Johnson, Ph.D., spanned 30 years in research and development as an organic/analytical chemist. He is currently founder and director of the Institute of Climate Studies USA (www.ICSUSA.org). Climate Science is published monthly.