Renewable Energy; Good News, Really!
Now, let us look at some good news. Renewable energy had a great year in 2024, worldwide, and contributed 92.5% of new power capacity to the different grids. It is dominating new power generation worldwide. “This is not even a competition anymore” per Zachary Shahan of CleanTechnica.
Some 585 gigawatts [GW] or [585,000,000,000 watts] of renewables were added and represents 15.1% annual growth. This data is courtesy of IRENA [International Renewable Energy Agency]. Let’s look at the bar chart titled, “Renewable share of annual power capacity expansion.” The calendar year is at the bottom of the graph [from 2004 to 2024] and there are two bars for each year.
The left-hand bar for each pair shows the increase in non-renewables in GW [mostly coal, oil, and gas] for that year. The right-hand bar of the pair, in darker blue, shows the increase in renewables. All units are in GW. So, for example in 2004, the non-renewable bar is about three times more [taller] than the renewable bar or about 75 GW.
Fast forward to 2012 and/or 2013 and see that the additions to power generation are about equal. At the far-right side of the graph for year 2024 note that the increase in renewables dominate [about 92%] by far the power generation capacity added. Solar and wind power accounted for almost all the growth with solar power alone accounting for about 77.3% of the total.
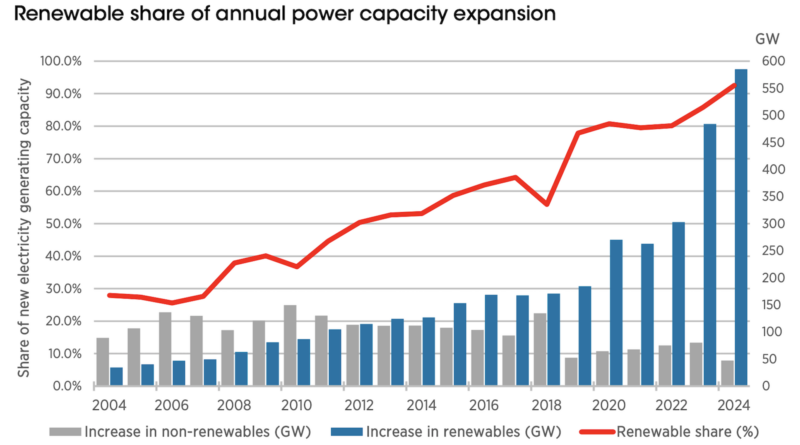
The dark red line in this same graph is the renewable share of the new power generation for each year and illustrates the slow but steady increasing share of renewables into the global grids.
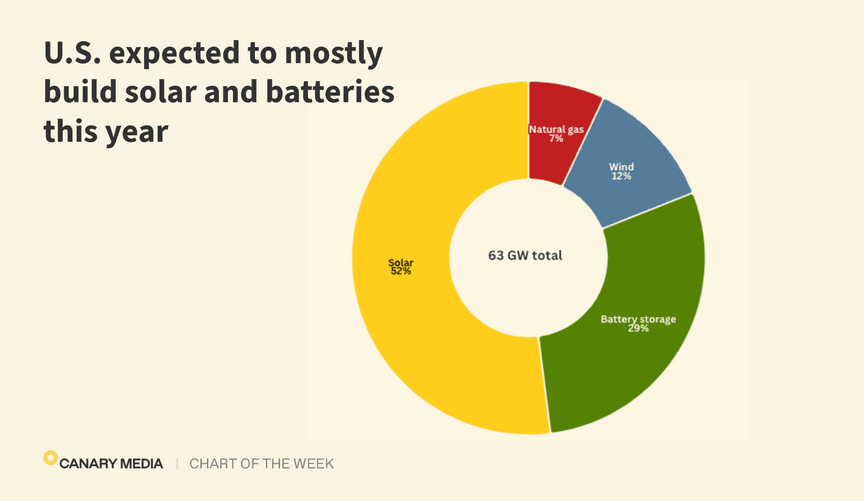
According to Canary Media, a Clean Energy newsletter, 2025 looks to be another banner year for renewables. This article was written by Julian Spector on February28, 2025, and published in Canary Media. See the circular chart titled, “U.S. expected to mostly build solar and batteries this year” with an estimated at 63 GW total. Starting at the top of this chart and moving clockwise is the anticipated power growth in Natural Gas [7%], Wind [12%], Battery Storage [29%], and with Solar at 52%. Keep your fingers crossed as 2026 may be different.
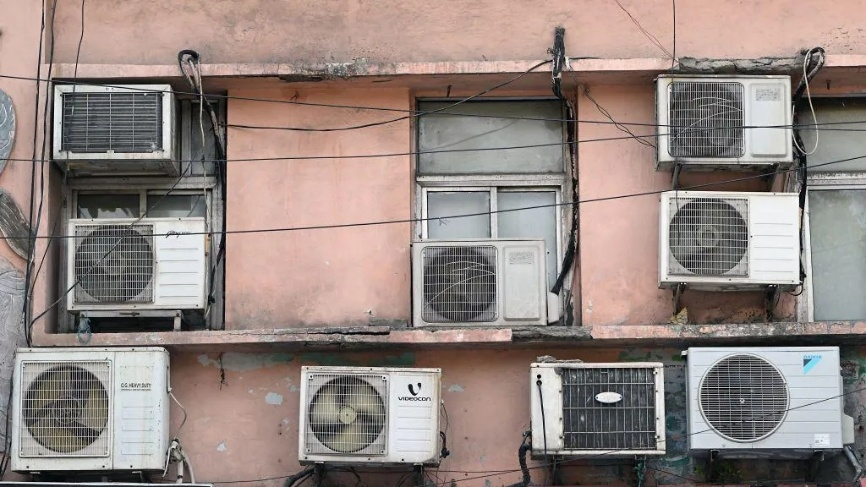
According to EHN [Environment Health News], “despite political opposition, solar and battery storage are expected to dominate new grid capacity in 2025, driven by the growing power demands of AI,” data centers, cryptocurrency, together with electric vehicles and air conditioners [see Getty Images.]
OK, so now the not so good news. Even with all the renewable power coming onto the grid in 2024 it was still less than growth in new electricity consumption.
Getty Images
As our planet warms the need for air conditioning continues to grow. The photo of a portion of a wall of an apartment building illustrates the growth of air conditioning and is from a BBC article “about India heatwave” on 27 June 2024. This heatwave scorched Delhi and it is estimated that about one billion people experienced heat stress across India during that heat wave and others that followed in 2024.
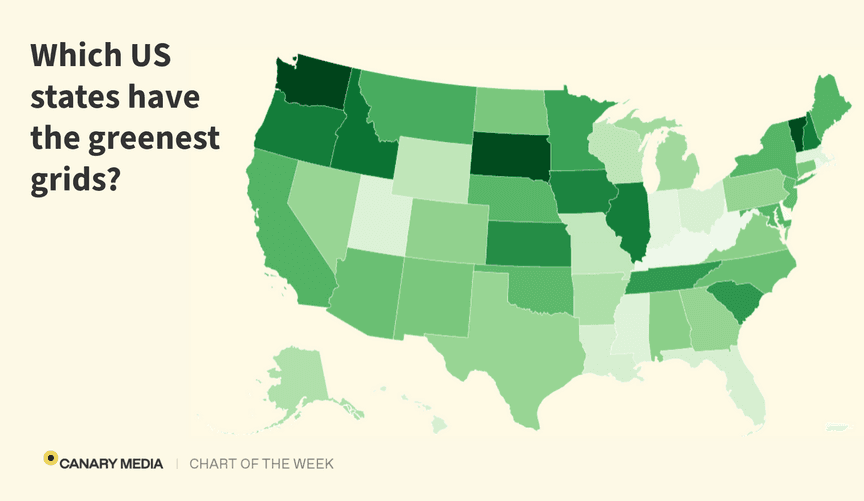
Then we have an analysis by Canary Media who published this map of the U.S. illustrating how “green” each states’ electric grid is. It is titled “Which US states have the greenest grids?” Three states stand out: Washington, South Dakota, and Vermont [in black].
The laggards are Utah, Kentucky, West Virginia [in white] with Indiana, Ohio, Louisiana, Mississippi, and Florida not far behind. All the other states, including Alaska, are developing programs to develop more renewable power generation. The progress is slow but steady.
An interesting number that has popped up recently is the number of full or partial electric vehicles [EV] purchased in 2024. According to CleanTechnica the world bought 17.2 million plugin vehicles, with 10.8 million of them pure battery-electric vehicles [BEVs]. This technological transition from fossil fuel vehicles to hybrids to full electric vehicles is happening rapidly with positive implications for reducing carbon emissions.
“Overall, 22% of new auto sales were plugin vehicles, more than one out of five, and 14% were BEV sales, almost one out of seven.”
Change, it is coming.
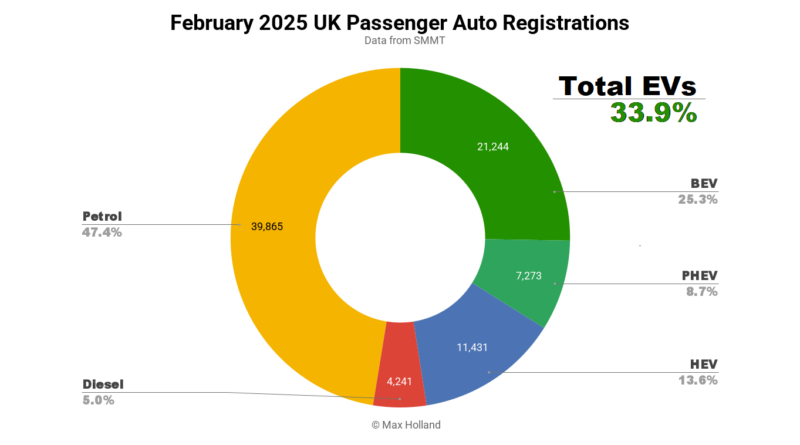
And then we have the latest information about the UK.
See the circular chart titled, “February 2025 UK Passenger Auto Registrations.” It states that 33.9% of those registrations are “Total EVs.” Starting at the top of the circular chart and moving to the right are BEV [battery electric vehicles] at 23.5%; and continuing along are PHEV [plug-in hybrid EV’s] at 8.7%; then HEV [hybrid EV’s] at 12.6%, with diesel and petrol making up the rest.
This transition to EV’s is coming at a time when we must reduce carbon emissions. As our planet warms and land ice melts, the meltwater flows into the oceans. And guess what? The ocean levels are rising.
As one might expect, NASA [National Aeronautics and Space Administration] in conjunction with JPL-Caltech has a most important chart on sea level rise. See graph titled “Satellite Record of Sea Level Rise.”
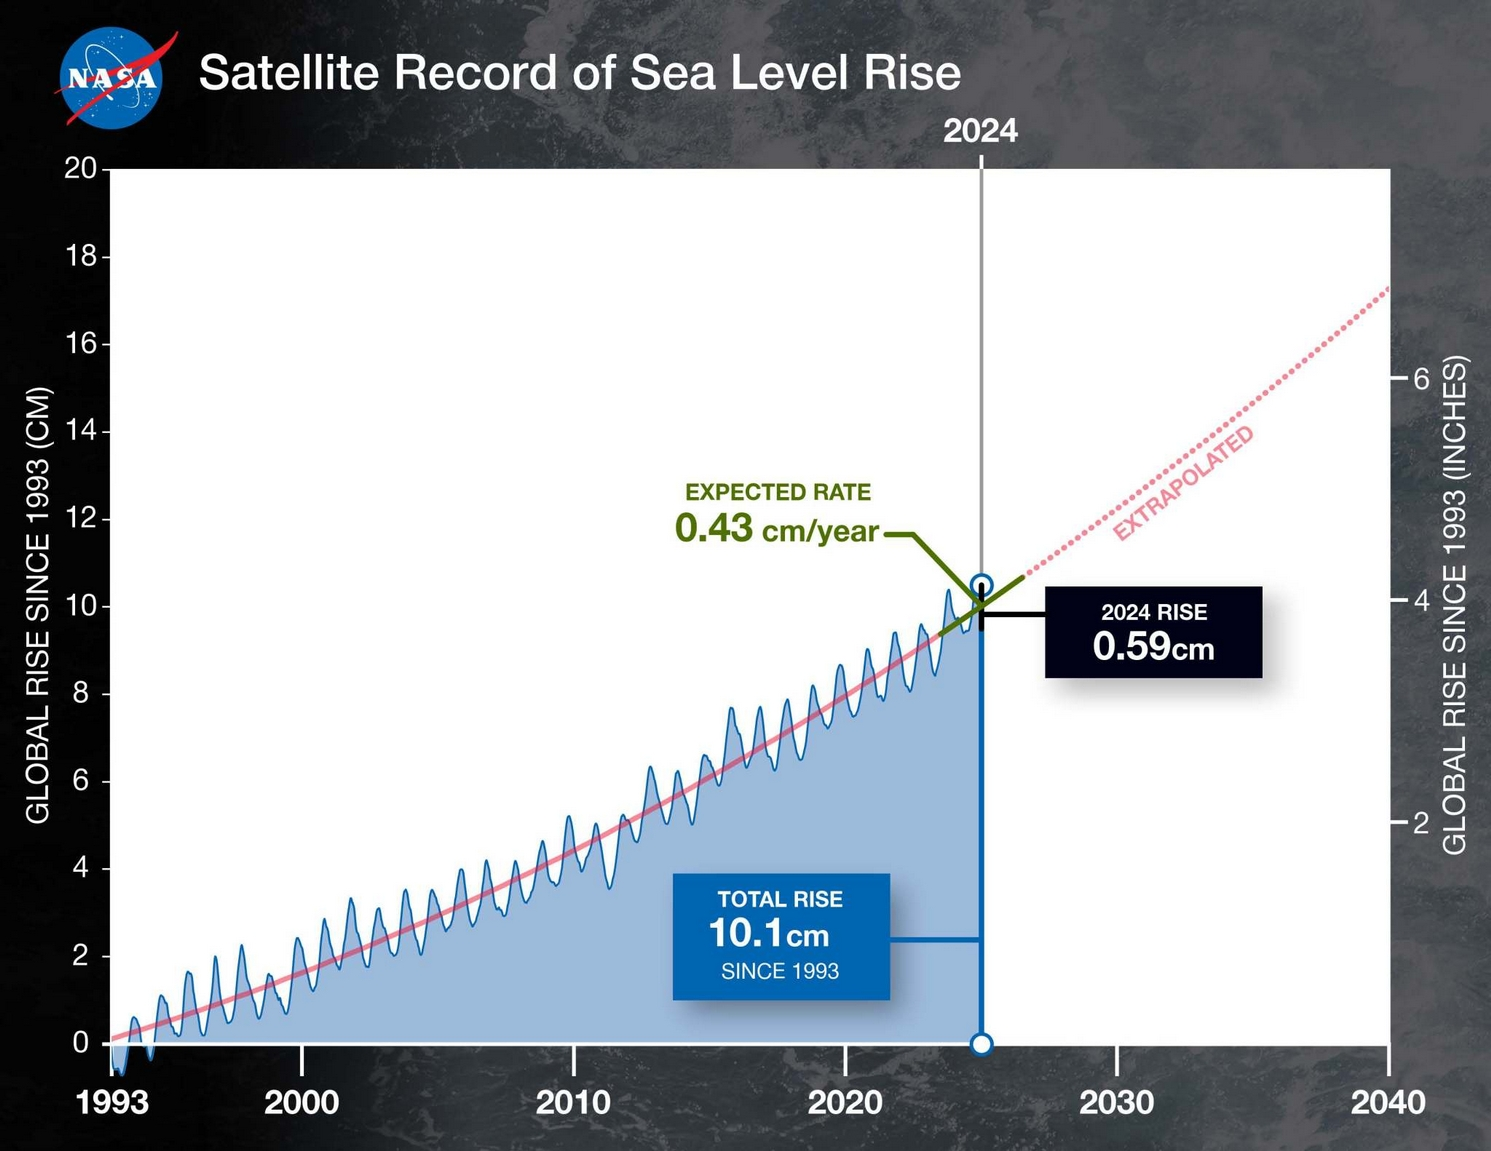
NASA/JPL-Caltech
This graph shows the global mean sea level rise (in blue) since 1993 as measured by a series of five satellites. The dotted red line projects the future sea level rise.
In 2024 the rise was 0.59cm [centimeters] or about ¼ inch, and about 10.1cm or about four inches over the past 3 decades. With water covering about 70% of Earth’s surface that is a huge increase.
Stay posted.
The scientific career of Raymond N. Johnson, Ph.D., spanned 30 years in research and development as an organic/analytical chemist. He is currently founder and director of the Institute of Climate Studies USA (www.ICSUSA.org). Climate Science is published monthly.


