


Greenland: A World Apart is Changing
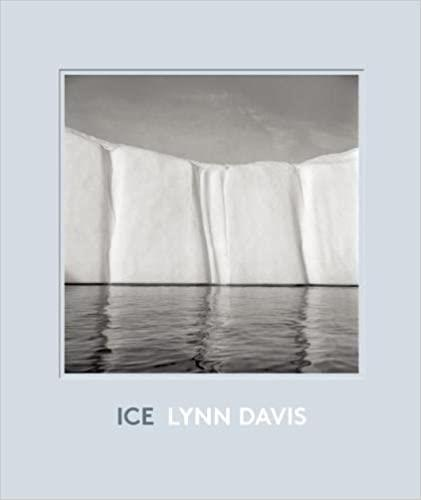
Her name is Lynn Davis. She is an American photographer who works in black and while and still uses mostly 12 exposure rolls of film. It was interesting to see her in a small, rocking boat, winding up a roll of exposed film in her camera and loading in another one. In her early career she was known for her photos of the human form.
Then she went to Greenland.
In 1986 she traveled to Disko, a small town on the western shore of Greenland and discovered for herself other forms, but this time it was of ice. Monumental forms of ice: their shapes, muted colors and shadows, movement, varying sizes fascinated her. This experience brought about a change to her work, a different focus, which now featured large landscapes and cultural/architectural icons for which she is well known.
See photo of a museum exhibition catalog cover: ICE, LYNN DAVIS.
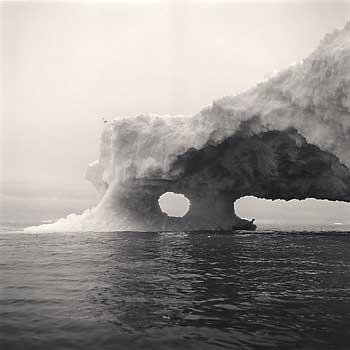
See also second photo: Iceberg 1, Disko Bay, Greenland Lynn Davis 2004, Exhibition Catalog. Many more examples of her work can be found on the web.
One of the planet’s largest glaciers, Jakobshavn, also known as Illulissat Glacier in Greenlandic, discharges some 35 billion tons of ice into the fjord and Disko Bay annually. This enormous volume of ice flows in a steady stream ranging from ice-cubes to bergs that are like mountains, hundreds of feet high.Incidentally, this Illulissat Icefjord was declared a UNESCO World Heritage Site in 2004.
Enter now the climate scientist Tony Leiserowitz [TL] of Yale University. Anthony Leiserowitz PhD is director of the Yale Project on Climate Change and, among many other related activities; he is also the host of Climate Connections, a daily 1 1⁄2 minute radio program broadcast each day available by email.
So, the artist and the climate scientist meet in Greenland and they talk about ice. They look at ice. They fly over it. They boat by it. They try to get a measure of the significance of it all. In mid-February 2021 their collaboration led to, and culminated in, the premier of a new film, “Meltdown.” It was directed and produced by Academy Award nominees Fred Golding and Mike Tollin.
The film is one hour long and available on Amazon. As per TL, it is an “exploration of art and science, beauty and tragedy, the personal and the global, set amidst the massive and spectacularly beautiful icebergs breaking off Greenland at an accelerating rate.”
All across the Arctic 2020 was an exceptionally warm year. Record high temperatures were recorded in Svalbard, an archipelago north of Norway that reaches as far north as 81 degrees North Latitude, some 900 miles from the North Pole. A new temperature record of 71 degrees F was set there and it was the highest temperature ever recorded in the European part of the Arctic [Wikipedia].
Ellesmere Island, in the Canadian Arctic, saw its last remaining ice shelf collapse, Siberia had record heat along with widespread fires, and a new record was set for low sea ice extent for July.
Let’s return to Greenland for the moment and see the map of this huge island published in www.carbonbrief.org/guest-post. In the last few decades satellite instruments have provided data that allow changes in ice mass to be measured. The map in color illustrates the geographic areas of ice mass loss [red], and ice mass gain [blue]. As noted, the map shows more losses on the western side of Greenland over the past year with gains mostly on the east coast of the island. These losses/gains areobtained when compared to the baseline period of 1981-2010 and the differences therefore are called “accumulated anomaly.”
When all of the data are analyzed the result is a net loss of 152 billion metric tonnes for the year [one metric ton = 2200 pounds]. This happens to be well above the medium rate predicted several years ago by the United Nations IPCC [Intergovernmental Panel on Climate Change].
It goes without saying that ice on land that flows into the sea results in sea level rise.
And sea level rise concerns us all.
See Graph with left vertical axis labeled “Sea level rise”, and the horizontal axis labeled “Temperature anomaly”. The two lines drawn on the graph are labeled “Observations” and “Models”. Note that the observed sea level rise is significantly greater than the models have predicted.
It is clear that sea level rise is occurring faster than predicted Climate change, global warming, is happening even faster than predicted just a few years ago.
On 24 June 1988, the New York Times reported on James Hansen’s Congressional testimony: ’It was 99 percent certain that the warming trend was not a natural variation but was caused by a build-up of carbon dioxide in the atmosphere.’ This is a quote from “Our House is on Fire” with Greta Thunberg, her parents and sister, p 171.
In the 33 years since that warning was made to the body politic and public, it has been pretty much business-as-usual. Except for the fact that renewables can compete pricewise with fossil fuels, the amount of carbon dioxide [CO2], the primary greenhouse gas, emitted to the atmosphere continues to increase each year.
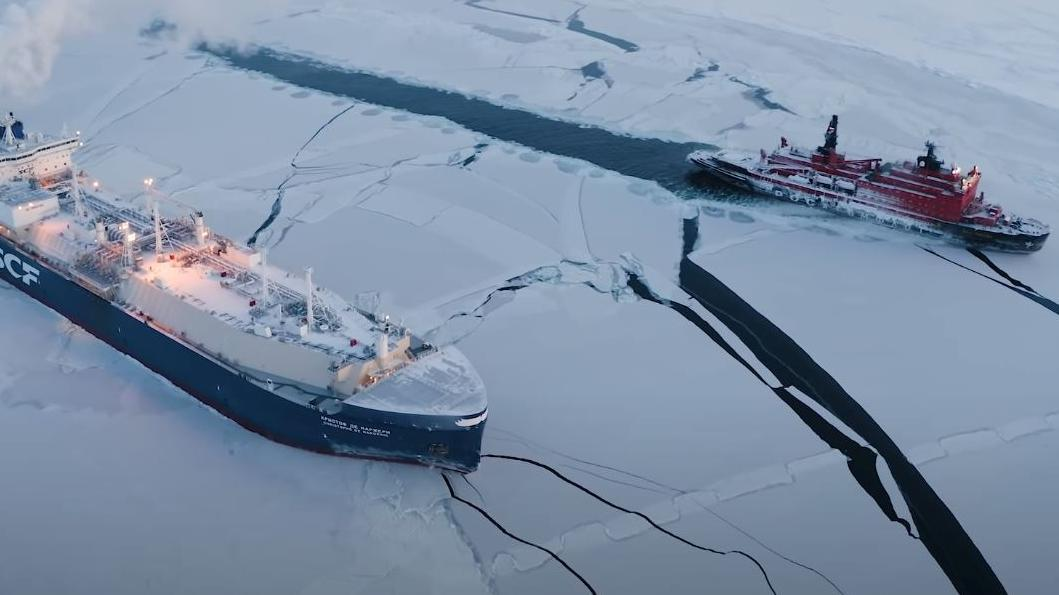
A clear example of global warming and changes in the Arctic occurred this February 2021, when a Soviet natural gas tanker, accompanied by a nuclear-powered Soviet icebreaker, delivered its cargo to China in a never before round trip across the Arctic Ocean. Previously, shipping along this northern route stopped in November and did not resume until July!
This cartoon from Yale Climate Connections in October 2020 says it all.

And so it goes ...
The scientific career of Raymond N. Johnson, Ph.D., spanned 30 years in research and development as an organic/analytical chemist. He is currently founder and director of the Institute of Climate Studies USA (www.ICSUSA.org). Climate Science is published monthly.