


Time for a Refresher: Basic Climate Change Science and Current Trends
Let’s talk about heat for a moment. Just plain heat. You know … the high and uncomfortable air temperatures large parts of the planet, and people, are currently experiencing. This past July about 100 million Americans were under a heat advisory/warning due to sustained high 90’s and triple digit
temperatures.
Then late July, it was reported that 2/3 thirds of the population of China were also under a high temperature warning; that is some 900,000,000 people! And they are not the only ones.
But perhaps a refresher short course is in order; like the ones many of us have to take from time to time in our businesses and work lives to stay current on all matters legal and professional.
So, let’s look at the illustration titled “The Greenhouse Effect” from Wikipedia which is a simple but accurate way of representing the science behind the warming of our planet. And it really is quite simple.
A century or more ago, our atmosphere had a very different composition than today.
As the illustration indicates, visible light from the sun enters Earth’s atmosphere and some of that light, and energy, is reflected back into space. The rest of it continues on to the planet’s surface where it is absorbed. The warmed objects then radiate back into space some of the heat as infrared energy which is invisible to our eyes.
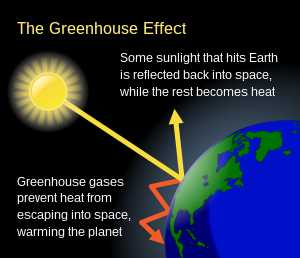
A portion of this out-going radiation, however, is now absorbed by carbon dioxide [and other greenhouse gases] present in the atmosphere and returned to the planet’s surface which increases its temperature. The more carbon dioxide [CO2] in the atmosphere the more heat that is returned to the
Earth’s surface. The levels are about 50% higher than they have been in the recent past.
So, what have we done to our atmosphere? In the last century or so, we have added about 2,400 gigatons of carbon dioxide to the air we breathe, primarily from the combustion of fossil fuels; coal, oil, and gas. Another way to express this quantity is 2,400,000,000,000 tons, or, … 4,800,000,000,000,000pounds of this gas to our atmosphere. Our atmosphere today is quite different than it was in the recent past.
It is important to note that about half of this CO2 has been absorbed by our oceans, and, if this was not the case, chances are we would all be toast.
These numbers may vary a bit depending on when the calculations were made and what assumptions taken, but the point is, it is an enormous quantity with consequences. It is enough to change the heat balance, and now imbalance, of incoming vs. outgoing radiation on our planet.
And so we warm.
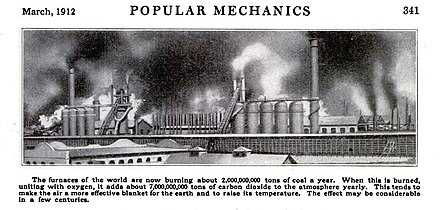
This is not new! In Popular Mechanics, page 341, March 1912, [see illustration and text] and even earlier, the effect of burning fossil fuels on the temperature of our planet was known.
But, there are solutions to this emissions problem and this involves, in part, moving to renewables sources for power and transport.
This has been a difficult transition problem and many people and institutions find it hard to accept, or are able, to adapt to change.
The Unites States Energy Information Agency [EIA] is a case in point. As the name implies it deals with all matters of energy: supply, availability, forecasting, policy, funding and so on. Back in 2001 the EIA projected the future renewable sources of electricity generation and came, up with the following graph.
See graph titled: “Projected versus Actual U.S. Electricity Generation from Wind and Solar, 2001-2020.
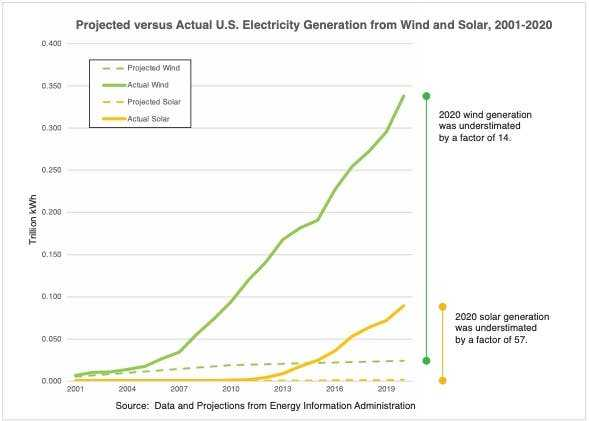
”The graph has two dotted lines near the bottom and two solid lines higher up. The bottom-most dotted line is the EIA forecast for the growth of solar power for that 20 year period: it barely budges from the baseline. The next higher dotted line is the EIA projection for electricity generated by wind power for that same 20 year timeframe. It shows a very slow upward trend that flattens out in a few years.
Next, let’s look at the first solid line above the 2 dotted lines which represents the actual amount of electricity generated by solar. The actual amount generated was 57 times more than forecast.
The top solid line shows the actual growth of wind power over that 20 year period and it was underestimated by a factor of 14.
How can the EIA get it so wrong!? This is their job. We can all speculate reasons but predicting the future is fraught with uncertainty.
Some of our leaders are beginning to step up to the plate and address the climate crises by displacing fossil fuel use as has Governor Dan McKee of Rhode Island. In July 2022 he signed into law historic legislation requiring that his state provide 100% of its electricity needs by renewable sources by 2033.
Next, look at the bar chart titled, “Operating and planned generating capacity additions (2022)”. The vertical axis is in gigawatts and the horizontal axis is months of 2022. This chart is from cleantechnica.com, August 4, 2022 with data from EIA.
The first portion is for the first 6 months of 2022, installed capacity, and the second portion is for the second half of 2022, planned additions.
Developers and project planners indicate that the U.S. will add 29.4 gigawatts [GW] of new capacity in the second half for a total of almost 45 GW for the year. This is an enormous amount of power with the bulk of it coming from solar and wind.And yes, NIMBY [not in my backyard] is an issue as more and more renewables are installed. So, entrepreneurs and planners are looking at some creative solutions.
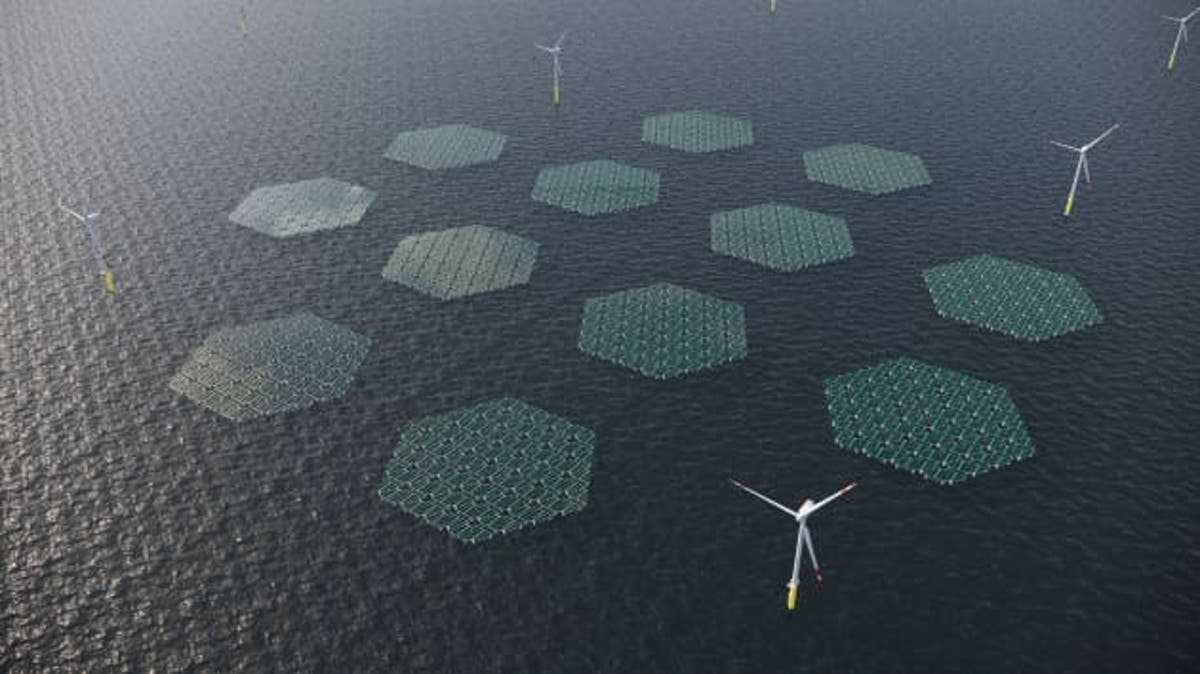
And, they have even come up with some new words; “floatovoltaics” is one. Rather than place solar installations on farmland why not use
reservoirs [see photo of hexagonal shaped floating solar arrays amidst wind turbines].
And then, we have “agrivoltaics” where solar farms are placed on tall poles in fields so that crops and livestock can grow and/or graze underneath.
There is no end to what we can do.
And so it goes.
The scientific career of Raymond N. Johnson, Ph.D., spanned 30 years in research and development as an organic/analytical chemist. He is currently founder and director of the Institute of Climate Studies USA (www.ICSUSA.org). Climate Science is published monthly.