


February 2011 - Fossil fuel dependence affecting climate change
I don't know about you, but I just love oil. As a matter of fact I am addicted to it and cheap energy, and I am not the only one, and that's the problem. NASA's National Climatic Data Center (NCDC), has reported that 2010 was tied statistically with 2005 for the hottest year on record, and these records date back to 1880.
Hmmm: is there a connection with fossil fuel consumption and warming temperatures?
According to NOAA scientists temperatures last year were "1.34 degrees F warmer than the average global surface temperature from 1951 to 1980," and 2010 marked "the 34th consecutive year with global temperatures above the 20th century average." Additionally, this warming occurred even when the Sun was in the deepest solar minimum in nearly a century and La Nina, which normally causes a cooling trend, was present for half the year.
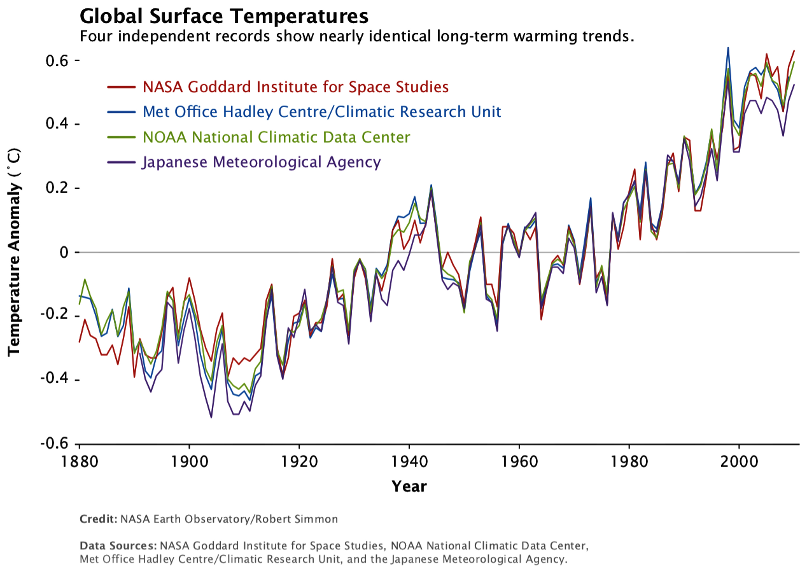
The 'Global Surface Temperatures' graph copied here, courtesy of NASA's Goddard Institute of Space Studies (GISS), shows more global warming datasets. The chart gives data from GISS, the Met Office Hadley Center/Climate Research Unit (CRU) in the United Kingdom, NOAA's NCDC, and the Japanese Meteorological Agency (JMA). The data sets are from three different continents and are in close agreement. To see the original chart in color and in more detail go to www.giss.nasa.gov/research .
In a preliminary report the JMA said that 2010 had the second highest average global temperature "since comparable data became available in 1891." "The agency attributed the rise in the average temperature to global warming caused by emissions of greenhouse gases and a rise in sea surface temperatures caused by El Nino..." See www.japantoday.com/category/national/view/average- .
The Finnish Meteorological Institute (FMI) has also reported in. According to statistics from the FMI,"the first decade of the 21st century was the warmest decade in Finland's recorded history, where records were taken all the way back to the 1840s." The previous warmest decade for Finland was the 1930s.
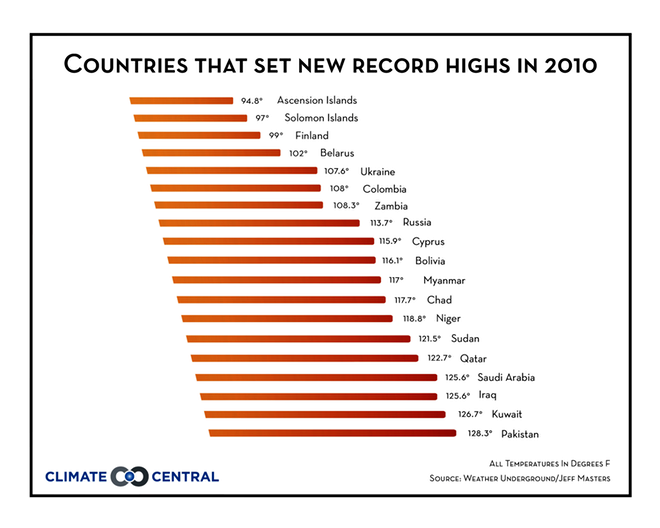
Further, 19 nations, whose aggregate land areas comprise 20% of the Earth's surface, set all time high temperature records last year. Note the Chart listing these countries and the fact that many are not near the equator.
And oh, just one more item: 2010 was also the wettest year on record in terms of global average precipitation according to the Global Historical Climatology Network. This fact is also consistent with climate change and global warming. Warmer air temperatures can hold more water and then release that water in more precipitation events (rain or snow), some of them extreme (floods and blizzards).
So, keeping this data and long term trends in mind, let's explore that 'fossil fuel addiction thing.' Bill McKibben in his book, "Eaarth," published in 2010, gives us a glimpse into this issue. In the past two centuries our civilization has been gifted with the discovery and utilization of cheap fossil fuel (gas, oil and coal). In the case of oil each barrel contains 42 gallons. It is estimated that each barrel has the energy equivalent of 25,000 hours of human labor and the average American uses 25 barrels a year! Wow!
This is what has made us prosperous and why our economies have grown. Is it any wonder that we feel threatened with the possibility of having some of this inexpensive labor taken away or made more expensive?
Checking my records, my car (4 cylinders, 5 speed standard) consumes about one barrel per month. Those 25,000 additional human labor hours equivalent permit travel, visits to family and friends and to do the additional activities associated with life in the U.S. today. It has been a great and easy ride but it has come with a cost: a cost that scientists are still trying to more fully understand.
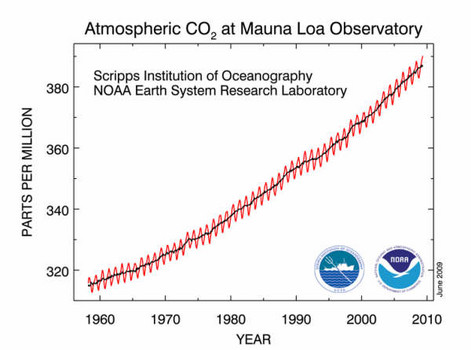
So let us consider the Keeling Curve. As a graduate student in the 1950's Charles Keeling was tasked with developing a method to analyze the carbon dioxide content in air, the primary greenhouse gas (GHG). He did just that, and over the past 55 years those measurements at Mauna Loa Observatory and that curve have become the iconic indicator of climate change.
This curve indicated here, courtesy of NOAA, shows the ever increasing levels of this GHG in our atmosphere. The level of carbon dioxide in the atmosphere today is about 390 parts per million (ppm). This level is 39% above pre-industrial times, 280 ppm, and higher than any amount seen in the last 700,000 years based on analysis of the ice core record.
A recent paper (Dec 2010) published in Science, Vol. 330, p356 (2010) from climate scientists at the Goddard Institute of Space Studies, is telling. Their peer-reviewed paper is titled "Atmospheric CO2: Principal Control Knob Governing Earth's Atmosphere." They state, "Ample physical evidence shows that carbon dioxide is the single most important climate-relevant gas in Earth's atmosphere. "
So we do have a connection with increasing consumption of fossil fuels, increasing levels of carbon dioxide in the atmosphere as a result of this combustion, and the knowledge that it has a powerful effect on Earth's climate.
All these trends and these data are having an effect on many policy and decision makers worldwide. Let's just take a look at some of the decisions and directions being taken:
In November 2010 visitors from Finland were invited to a conference at Whiteface Mountain to talk about their plans for winter sports in a warming environment. As part of the discussion they mentioned that Helsinki, Finland's capital, has developed building codes prohibiting building on land less than 6 ½ feet above current sea level. The city planners are taking into account rising sea levels as a result of global warming. The representative also stated that Hamburg, Germany has made the same code requirement.
On December 11, 2010 the New York Times (NYT) reported on a story from Kristianstad, Sweden. The city fathers vowed a decade ago to wean itself from the fossil fuels coal and oil. It seemed a tall order but the city and surrounding area with a population of 80,000, not unlike Clinton County, essentially use no oil, gas, or coal to heat their homes and businesses today. There was no magic ingredient here: no solar panels, or wind turbines were involved, just a collective will.
Once the city fathers changed their headset they saw fuel everywhere. The city decided to use assets at its disposal such as potato peels (from nearby vodka plant), manure, used cooking oil, stale cookies, pig intestines, etc. They use a large 10 year-old plant on the outskirts of town to transform this stuff into biogas, basically methane. This "gas is burned to create heat and electricity, or is refined as a fuel for cars."
This story was particularly encouraging, to me, since this city lies far to the north of Plattsburgh and demonstrates what is possible when the city fathers got the "vision thing."
On December 30, the NYT reported that the Massachusetts secretary of energy and environment "announced a plan to curb heat-trapping gases emitted by homes, cars and businesses in the state by 25% below 1990 levels over the next decade." The plan is considered realistic and doable.
Many, many more creative and effective examples such as the above have been reported. Many decision makers who are seeing the data are deciding to do their part in reducing GHG emissions and resulting impact on climate change.
"And so it goes."
The scientific career of Raymond N. Johnson, Ph.D., spanned 30 years in research and development as an organic/analytical chemist; he is currently founder and director of the Institute of Climate Studies USA (www.ICSUSA.org). Climate Science is published the first Sunday of every month.