August 2011 - Past Temperature Changes Have Current Meaning
"Long, long ago, the planet Earth got warm: very, very warm." Is this the beginning of a fairy tale? Not really, but it is a fantastic story and still emerging from the pages of Earth's history.
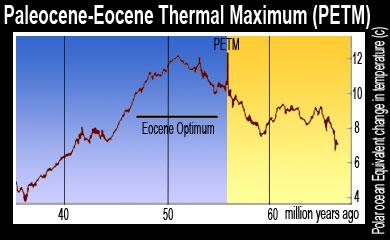
Data show that about 56 million years ago our planet got very warm. This period is shown in the chart labeled Paleocene-Eocene Thermal Maximum. It is a bit of a mouthful, which is why the abbreviation PETM is mostly used.
The research is of major interest because the temperature spike was sudden and huge. The chart shows a large spike in temperature of about 5 degrees centigrade, or 9 degrees Fahrenheit, over earlier conditions.
Carbon dioxide levels also peaked (not shown), and the data suggests that the levels were perhaps four to five times that of today's. Sea levels were also far higher, and the polar ice caps were gone.
The obvious implication, and of interest to scientists, is the fact that we are combusting enormous amounts of carbon-based fossil fuels today, with a resultant 40-percent increase in atmospheric carbon dioxide levels, mostly in the past 100 years. An MIT study has estimated a doubling of today's levels by 2100, under a "business as usual" scenario, or about half the PETM levels.
So what was going on? Humans cannot be blamed for that event, as we were not even a twinkle in nature's eye then.
Enter Paleoclimatology. This relatively new discipline is the study of past climates. This sounds straight forward, but the challenges of understanding events millions of years ago are formidable. Determined scientists have, however, developed new tools and techniques, and with lots of field work, found rock layers and ocean cores that span that time period. This has given us a good glimpse of what happened back then.
Lee Kump is a professor of geosciences who has spent many years studying PETM. He recently published a peer-reviewed paper in this June's issue of Nature Geoscience and summarized this data together with earlier findings in the July 2011 issue of Scientific American.
He paints a picture with just enough color to give us a glimpse of what conditions on Earth must have been like. Plate tectonics, the slow shifting of Earth's land masses about the surface, was almost finished pulling apart the large supercontinent, Pangaea. Large quantities of carbonate containing ocean sediments and other carbon containing layers (peat and coal) were being subjected to tremendous heat. This resulted in huge amounts of two greenhouse gases (GHG), methane and carbon dioxide, being released to the atmosphere. Remember, methane is 20 times stronger than carbon dioxide as a GHG.
This activity began to warm the planet a few degrees, but this was just the beginning.
As the planet warmed earth and ocean, a tipping point was reached and large stores of frozen methane bubbled up from the depths and added more of this potent GHG to the atmosphere. It is thought that other positive feedbacks kicked in as well, such as droughts, desiccation of land surfaces, wildfires and thawing of the permafrost. The latter may have been a clincher. Vast stores of methane laid frozen in the Arctic permafrost and can be released into the atmosphere.
Different combinations of these events appear to have set off a "perfect storm."
Dr. Kump traveled in 2007 to Spitsbergen, in Norway's Arctic Svalbard (archipelago find that on the map!), to study rocks from this time when palm trees and ferns inhabited this area. His research team came up with some startling findings: e.g. the global temperature today is rising much more quickly than during the PETM. The data also suggest that we are injecting carbon dioxide into the air 10 times faster than during the PETM. As he states, this has "profound implications."
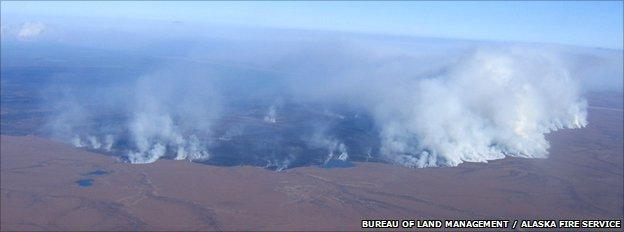
The photo from the Alaska Fire Service is of a huge Arctic fire in 2007 in northern Alaska that burned more than 400 square miles of tundra overlying permafrost. It is the largest on record and doubled the amount of tundra burned since 1950. Only the snows in October put it out. It released about 50 years of stored carbon. If we are reading the rocks right, our current rates of combustion of oil, coal and gas are setting the stage for some major climate event to occur.
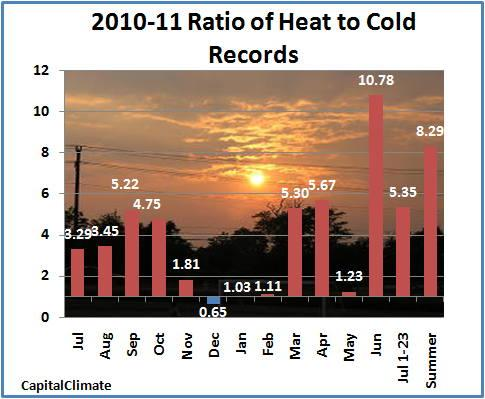
In a stable climate one might expect the ratio of "Heat to Cold" temperature records to vary around one. Only one month in the last 12 was below one (see December in the chart). But in June the ratio is almost 11:1 more heat records than cold records, and for the summer the ratio is 8:1. All these data are telling us something.
Are we listening?
And so it goes.
The scientific career of Raymond N. Johnson, Ph.D., spanned 30 years in research and development as an organic/analytical chemist; he is currently founder and director of the Institute of Climate Studies USA (www.ICSUSA.org). Climate Science is published the first Sunday of every month.


