February 2010 - Separating the Seeds from the Chaff
When humans began farming some 9,000 or so years ago, they developed a simple technique to separate the nutritious seeds from the other non-edible plant components. The process, called winnowing, involves tossing the components into the air; the heavier, denser, seeds fall down and the lighter chaff is blown away by the wind. By analogy we have the same issue today when climate change or global warming is discussed in some of the print, radio or TV media. We have a lot of chaff interspersed with the seeds.
Let us look at some of the ‘seeds’, the product of our national and international research effort, as scientists report on their efforts to understand climate change. These seeds are all data based. They are not based on opinion, or misunderstanding, or misinformation. This understanding of our environment was subjected to scientific peer review before it was published to ensure that it met the highest standards of data quality and interpretation. The year 2009 was a rich year in terms of this climate research so let’s take a look at just a few of the findings.
The first chart below shows the measured temperatures for Land and Ocean for the past 130 years. The black squares are the annual temperature means with the broad line representing the 5-year means. The data, courtesy of NASA, is quite clear. There has been a steady increase in global temperatures over the past century and especially in the past 30 years. The chart is also interesting in
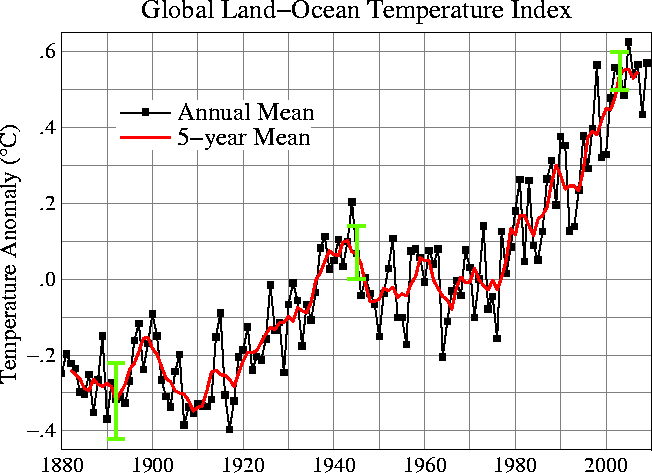
that it shows the year to year variation imposed by the vagaries of ‘weather’. Remember, weather is what we experience in the short term [days, weeks, months] while climate change is what we see over the ‘long’ term [years and decades]. Many broadcasters may look at just one day, one week, or one year [say 2008] and say the planet is cooling. However, that is really ‘weather’ not climate. The chart is clear, the ‘climate’ trend over the past several decades is definitely warming.
NASA, when providing this data, also stated that the past decade is the warmest in recorded history. The World Meteorological Organization and the U.K. Met Office also came to the same conclusion. When the numbers for the Southern Hemisphere alone are reviewed, 2009 is the hottest year on record. When the North Country, and some other parts of the U.S., experienced cold weather recently, the idea of global warming was doubted by some. But what was not stated in most weather reports was the fact that Alaska had its 17th warmest December and that global temperatures were still averaging above normal. What we see from our window, or experience on a daily basis, is far different from what is happening on a global basis.
And here is an update on the increasing shore erosion in parts of northern Alaska as was reported earlier. According to a presentation given at the 2009 American Geophysical Union Fall Meeting, by Bob Anderson of the University of Colorado, the coast has eroded at an average annual rate of more than 33 feet since 1955. And that rate has now accelerated in the past year [2009] to more than 45 feet giving this area some of the fastest coastal erosion rates in the world.
Why? There are three reasons; less coastal sea ice, warmer sea water, and larger waves. The ice free coast is subjected to storms, and wave action with warmer water, for two additional weeks every decade, in the fall. The net result is that the Army Corps of Engineers plans to move at least five Inuit villages, at current count [up from one village in an earlier report], further inland at an estimated cost of more than $1,000,000,000 [yes, one billion dollars]. These are measurable facts; no opinion or arguments about this. Global warming is costing us, all of us.
The Proceedings of the National Academy of Sciences on December 1, 2009 reported unprecedented tree ring growth in bristlecone pines at the highest elevations in western North America. These trees are over 3,500 years old and the growth in the last 50 years is the highest in the tree ring record. The primary author, M. Salzer, is at the Laboratory of Tree-Ring Research, at the University of Arizona in Tucson AZ. After evaluating a number of factors, he and the other three authors have concluded that increasing temperature at high elevations is the predominant cause.
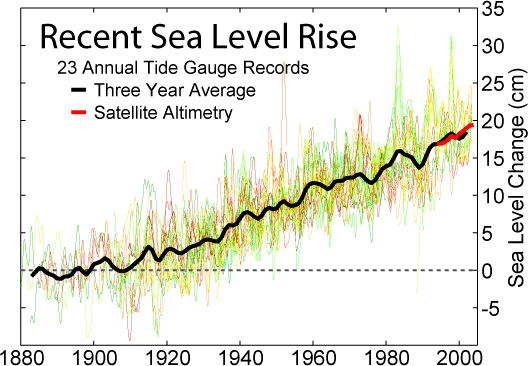
Let’s look at another factor that is fully measurable: sea level rise. When we view, in the chart below, this 120 year data collection from tidal gauge records and, for the past 15 years, satellite measurements, it is pretty clear our planet is undergoing a major change. There are at least two reasons for this sea level rise: warming sea water with its resulting thermal expansion and an increased amount of melting from glaciers and icecaps. The chart, obtained courtesy of Wikipedia, shows an average rise of about 1.8 millimeters per year in the 1900’s, increasing to about 2.8 millimeters per year in the 2000’s. And remember, the oceans already cover about 70% of the Earth’s surface to an average depth of more than 10,000 feet.
And there are more data available, a lot more, and all the data support the fact that global warming and climate change is happening now. These data are the grains, the seeds. They are real, measureable and pass the test of peer review. The denial of these data, just like chaff, is lightweight and blows away in the wind.
The scientific career of Raymond N. Johnson, Ph.D., spanned 30 years in research and development as an organic/analytical chemist; he is currently founder and director of the Institute of Climate Studies USA (www.ICSUSA.org). Climate Science is published the first Sunday of every month.


