At first glance many may read the latter portion of the title as “carpe diem” which is a Latin phrase translated as “seize the day.” It happens to come from the Roman poet Horace’s book, ‘Odes’ from 23 BC. “The ode says that the future is unforeseen” and that “one should do all one can today to make one’s future better.”
In point of fact this play on words, CarbonDiem, is the name of a new smartphone app, and company, that provides the user with information on the carbon footprint of a persons’ travel plan. It provides estimates of carbon dioxide [CO2] emitted based on that persons travel options [train, car, plane] using GPS technology.
Since transport represents one third of global greenhouse gas [GHG] emissions, presumably, the person can then choose the travel plan that emits the least CO2.
So why all this focus on CO2?
The story actually starts at least 150 years ago when it was discovered that the carbon dioxide molecule itself has certain strong absorption bands that allows it to absorb infrared energy. This led to speculation at that time that changes in the amount of this gas in the atmosphere could have an effect on the temperature at the Earth’s surface.
A calculation was even made of the increase of Earth’s surface temperature based on the projected amounts of fossil fuels burned. It turned out to be an underestimate because back then scientists never imagined that we would be burning so much fossil carbon.
Now let’s fast forward to 2015 when a peer-reviewed paper was published in Geophysical Research Letters by X. Zhang and Ken Caldeira. They reported that “the heat generated by burning a fossil fuel is surpassed within a few months by the warming caused by the release of its carbon dioxide into the atmosphere:” a significant finding.
Unfortunately, this is a gift that will keep on giving for centuries.
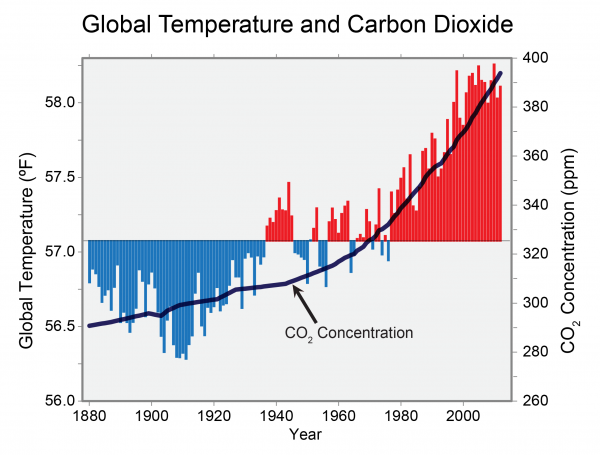
This graph from National Center for Atmospheric Research labeled “Global Temperature and Carbon dioxide,” “shows global annual average temperature measured over land and oceans. Red bars indicate temperatures above, and blue bars indicate temperatures below, the 1901-2000 average temperature. The black line shows atmospheric carbon dioxide concentration in parts per million.”
The correlation, and causation, between these two parameters is very strong. As the CO2 levels have increased over the past century so has Earth’s temperature.
The National Oceanic and Atmospheric Administration [NOAA] keeps track of all weather events and their associated costs and is illustrated in the bar graph, “Billion-Dollar Disaster Event ...” It is obvious that the height of the bars [number of events] is increasing steadily in moving from 1980 to 2017 [July] with the costs adjusted for the Consumer Price Index.
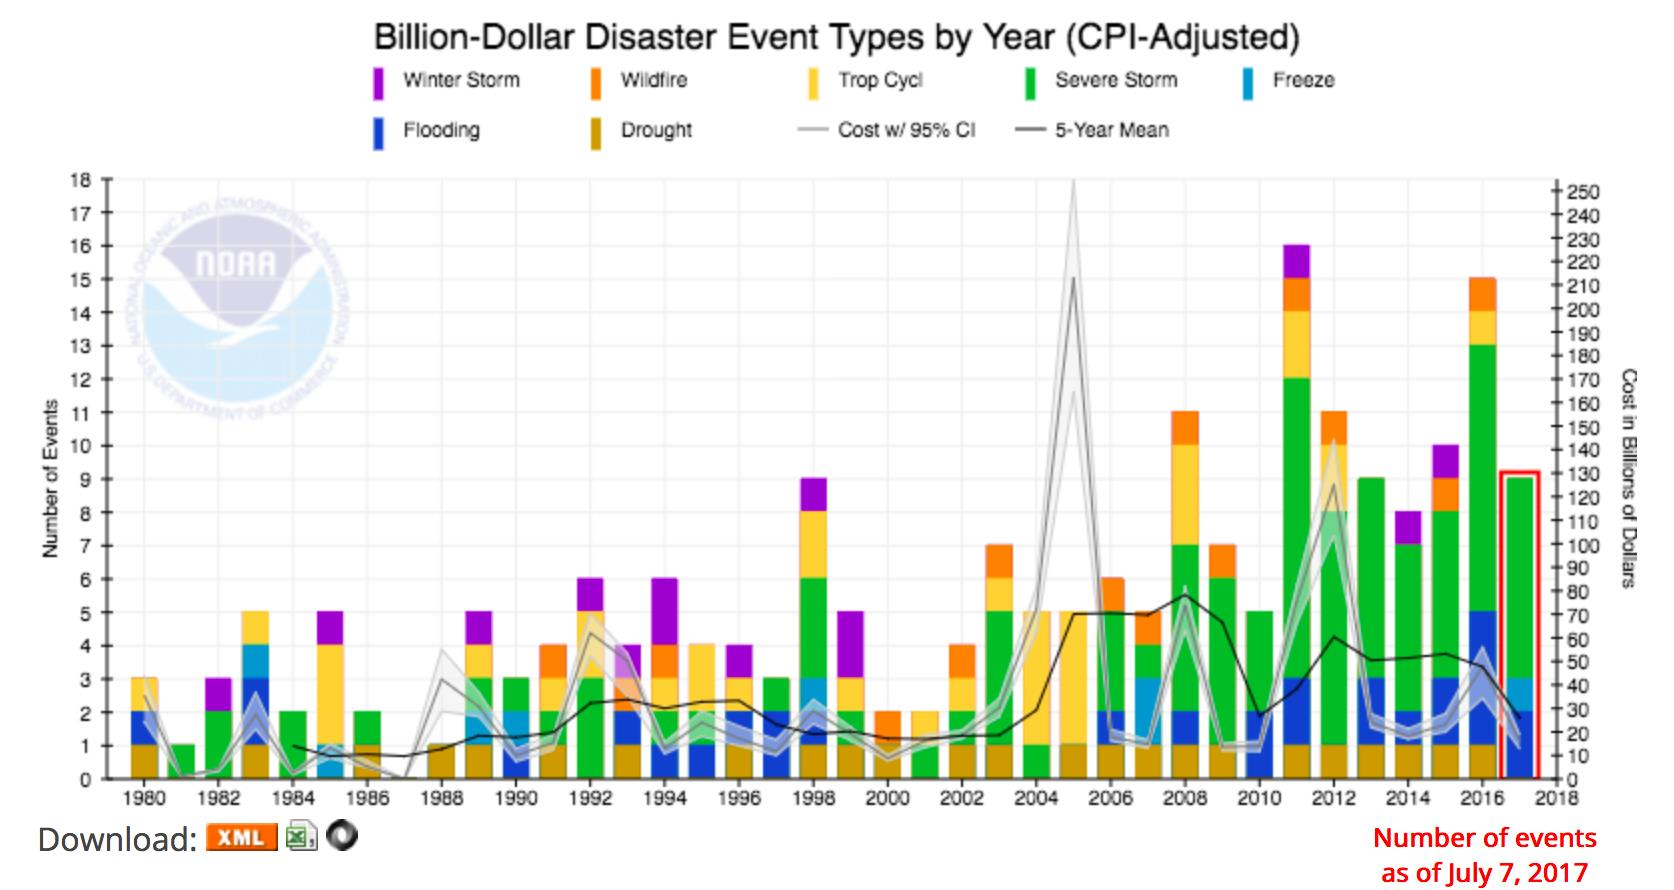
It is notable that with the data only through July 7, 2017 it does not include extreme weather events since then. Preliminary estimates of the cost of Hurricanes Harvey, Irma, Jose and Maria exceeds $290 billion [AccuWeather September 12, 2017] and will take us off the chart.
Now we are beginning to talk about some real money. This represents about 1.5% of the total annual Gross National Product [GDP] of the United States.
These extreme events may be a part of a new “norm.” Earlier this year California and other parts of the West had record breaking rain and snowfall events. But then the drought started along with high temperatures and very dry air. Add in lightning strikes to this mix and this brew has led to an earlier than normal wildfire season across parts of five states; CA, MT, ID, WA, and OR with millions of acres burned.
More than 24,000 firefighters have been battling some 237 blazes, some for as long as six months.
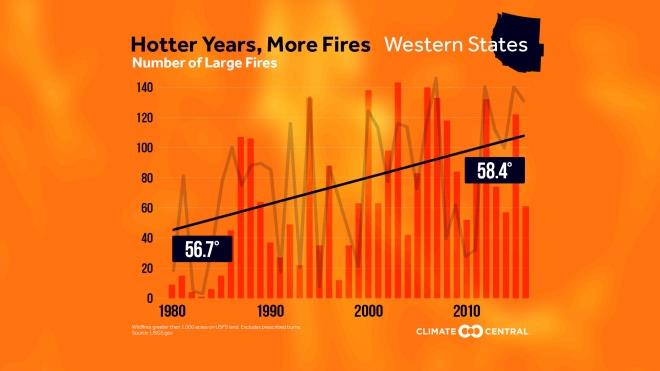
See chart from Climate Central, “Hotter Years, More Fires...” It shows that with increasing average temperatures over past 35 years there is an increase in the number of large fires.
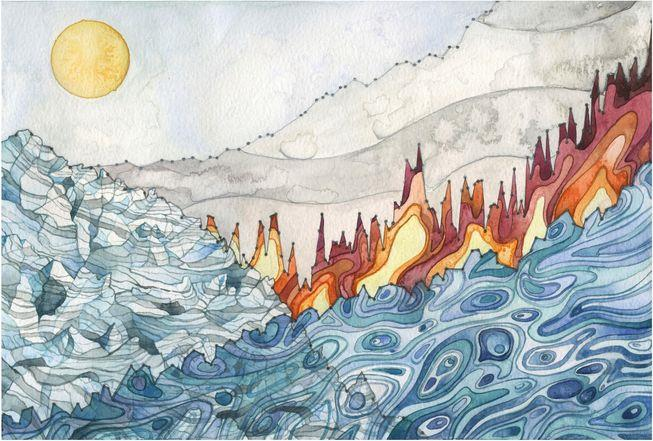
Artist-Scientists are also feeling the need to express current climate change into their art work. One of them is Jill Pelto, a graduate of University of Maine with a double major in Earth Science and studio art.
Her watercolor reproduced here is titled, “Landscape of Change.” It includes four climate parameters; rising sea levels, increasing global temperatures, glacial ice decline and rise in fossil fuel use.
And so it goes.
The scientific career of Raymond N. Johnson, Ph.D., spanned 30 years in research and development as an organic/analytical chemist; he is currently founder and director of the Institute of Climate Studies USA (www.ICSUSA.org). Climate Science is published the first Sunday of every month.


Climate Change: Carbon Diem