


Climate Change and the Great Disruption
What exactly does disruption mean? Dictionary.com gives a definition: “a radical change in an industry, business strategy, etc., especially involving the introduction of a new product or service that creates a
new market.” And all indications are this change will be “radical.” Disruption is a result of a convergence of several technologies, and the inability of many companies to accept and see the opportunities that might arise. Over the next decade or so it has, and will, reshape our lives in a number of ways. Let’s look at a couple of recent examples of disruption and its consequences.
AT&T developed a cell phone and in 1985 they wanted to obtain an estimated market for it. A consulting firm, McKinsey and Co., was hired and they estimated 900,000 phones by the year 2000. Actually the number turned out to be 109 million according to Tony Seba at Stanford. The estimate was off by a factor of 120 times. In 2011 there were 6 billion mobile phone subscribers.
Mr. Seba also quotes Steve Ballmer, CEO of Microsoft, who said in 2007: “There is no chance that the iPhone is going to get any significant market share. No chance....” Mr. Ballmer and other smart people wondered who would pay $600 for an iPhone when they could buy a Nokia phone for $100? In fact it sold 3.7 million phones in the first year [2008] and total iPhone sales now exceed 1 billion [July 2016].
Agencies, think tanks, and senior executives can be way, way off in their projections of “change” and its impact on their business.
Kodak had it biggest sales year in 2000 at $14 billion. Yet, in 2012 it filed for bankruptcy! Even though it invented digital technology Kodak underestimated its potential and missed out on the digital camera revolution. Talk about disruption! Seba’s book, “Clean Disruption” is an excellent one that discusses these and more.
The pie chart from the EPA [Environmental Protection Agency] website titled, “Total U.S. Greenhouse Gas [GHG] Emissions by Economic Sector in 2015,” indicates that “Electricity” generation accounts for 29% of the total while “Transportation” is not far behind at 27%.
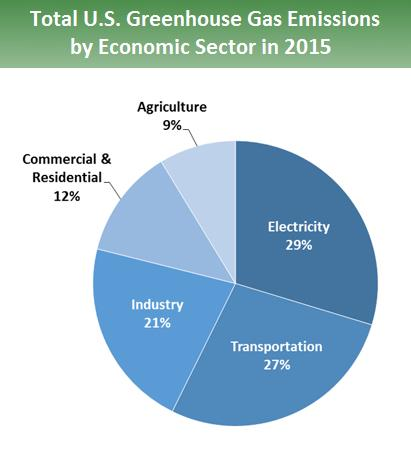
Let’s concentrate on one portion of the U.S. GHG emissions: “Electricity”.
A reduction in GHG emissions here will greatly help in addressing climate change. Technology disruption can be observed in the graph: “Swanson’s Law”. It’s based on an observation by Richard Swanson, “that the price of solar photovoltaic [PV] modules tends to drop 20% for every doubling of cumulative shipped volume” [Wikipedia]. The log-log graph shows the cost reduction for the price of crystalline silicon PV cells in $/watt. In 1977 the cost was $76.67/watt and by 2014 the price had dropped to $0.36/watt.
Thus the cost is more than 200 times lower than in 1977 [based on 2014 data]. This graph is also called “the learning rate.”
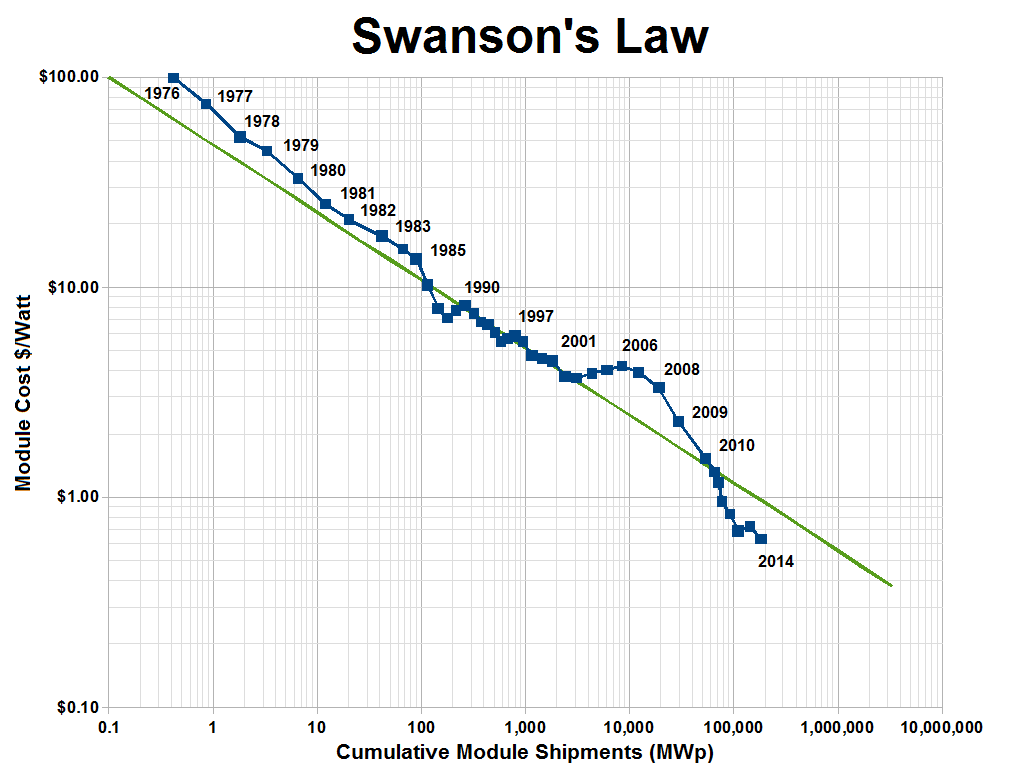
Module costs have dropped in half since 2008. The implication is that if one made a business decision in 2008 to proceed with a nuclear or fossil fuel burning generating plant based on the cost of PV modules at that time, that business plan may have to be scrapped today due to the rapidly falling PV costs. It would not be economical.
And, this is exactly what is happening around the world. Hundreds of coal burning plants are being retired, mothballed, and/or construction stopped with China taking the major initiative.
The bar chart, “Global Solar Energy Capacity (GW)” details this extraordinary PV growth. It highlights the gigawatts of PV capacity and its near exponential growth in the last 15 years. Separately, for the U.S. alone, this trend indicates that solar could contribute 20% of total electricity consumption by 2030.
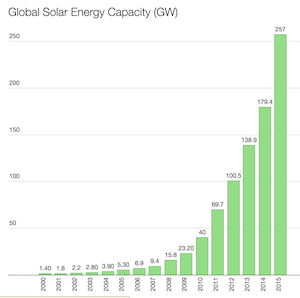
This growth in solar will reduce coal mining, number of coal burning plants, nuclear power facilities and even oil sand extraction and drilling in locations that are expensive [deep water, difficult locations – Arctic] and so on.
And we have not even discussed the impact of wind turbine technology yet. Next time!
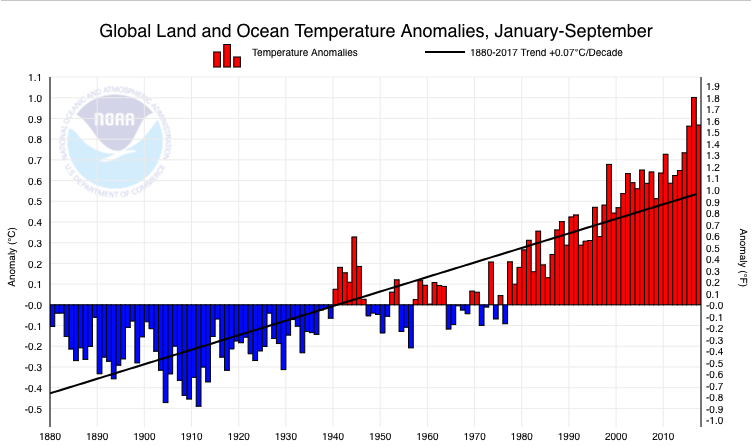
Meanwhile, our planet continues to warm. The National Oceanic Atmospheric Administration [NOAA] bar chart shows that warming trend with the first 9 months of 2017 among the top three warmest in the 137 year climate record.
And so it goes.
The scientific career of Raymond N. Johnson, Ph.D., spanned 30 years in research and development as an organic/analytical chemist; he is currently founder and director of the Institute of Climate Studies USA (www.ICSUSA.org). Climate Science is published the first Sunday of every month.