


Volcanos and Climate Change: It’s All in the Numbers
On May18, 1980, Mount St Helens in Washington state, erupted with an enormous explosion. Weeks before, rumbles in the mountain itself, thousands of earthquakes large and small, smoke drifting from the peak, deformation on the side of the peak itself, all signaled that something may happen. When it did blow it was quite an event. See photo by Richard Bowen.
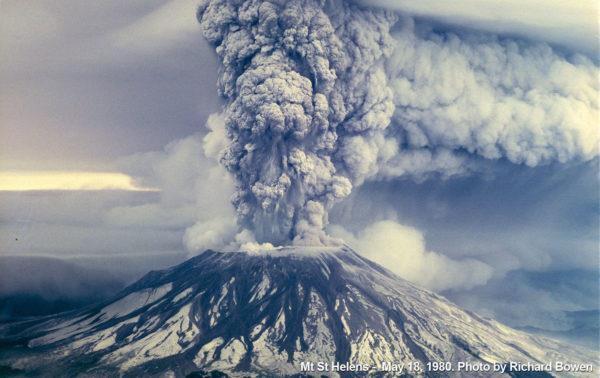
On the explosive index scale [EIS] of 1 to 8, with 8 being a super eruption, it was rated a 5. In all, 57 people died, over a billion dollars of damage incurred, thousands of game animals killed and hundreds of square miles of forest reduced to a wasteland.
The gas and ash plume reached 80,000 feet into the atmosphere with measureable ash deposits in 11 states. Some of the mudslides and flows reached the Columbia River some 50 miles away traveling near the speed of sound, some 600 mph. It was “the most deadly and economically destructive volcanic eruption in the history of the United States.” [Wikipedia] The thermal energy released was equal to about 1,600 bombs, each the size of the atomic bomb dropped on Hiroshima.
So what has all this to do with Climate Change?
Some people considering this awesome power of nature, believe that events such as this are bringing about Climate Change and that we humans are either not the cause, or at best, a small player in the weather/climate system.
But let’s take a quantitative view of this situation, look at the numbers, and put this natural occurrence into perspective with the human influence on climate.
The United States Geological Survey [USGS] estimates that Mt. St. Helens emitted about 10 million tons of carbon dioxide [CO2] in that event: not an insignificant amount of this greenhouse gas [GHG]. They also estimate that annually, about 260 million tons of CO2 are emitted from all of the volcanos on earth.
But let’s put these numbers into perspective. The Federal Highway Administration has calculated based on gas consumption and miles driven, that the 253 million cars in the US emit about 1.2 billion tons of CO2 annually. Please note: this does not include the US GHG emissions from trucks, airplanes, heating/cooling of homes/businesses, electric power generation etc.
So, this single aspect of human sourced GHG emissions [cars] is about five times the amount of GHG’s emitted by all of the volcanic eruptions on the planet.
With total U.S. greenhouse gas emissions of 6.8 billion tons per year, this is equivalent to a Mt. St. Helen’s eruption happening almost twice a day in the U.S. alone. [Planetsave.com/2016/12/02]
Globally, human produced GHG emissions, from all sources, are on the order of about 40 billion tons per year.
Clearly, volcanic eruptions contribute very little to global GHG emissions and the climate change underway.
This science is well understood and accepted by the rest of the world. At the Climate Conference in Marrakesh in November, 2016, 195 nations including the U.S. reaffirmed their commitment to reduce GHG emissions. See photo “We Will Move Ahead” taken at the conclusion of that meeting [courtesy COP22]. The goal is still to try to limit Earth’s temperature rise below 3.6 degrees F [we are already plus 2 F higher than long term average].

So what can be done? There is a lot happening right now to reduce emissions. We are beginning to see a convergence of technologies, business opportunities, cost reductions, and policy leadership at the state and local level that all combine to begin the changeover from fossil fuels to renewables.
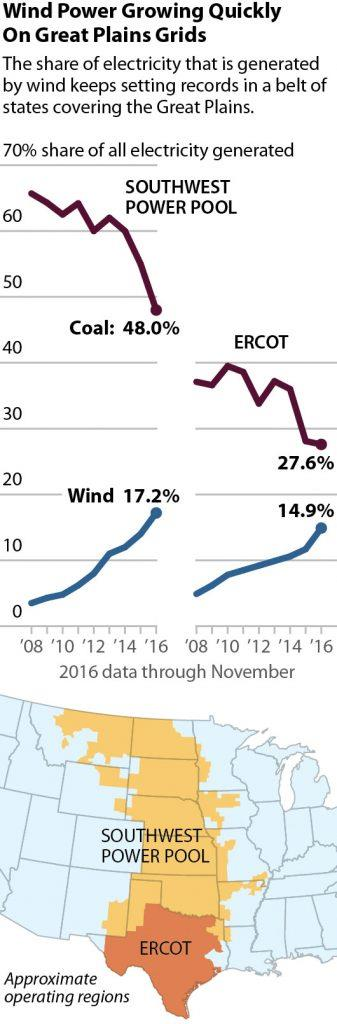
The graphed data, titled “Wind Power Growing Quickly On Great Plains Grids” is a case in point. Cleantechnica.com/2016/12/21/wind-energy. It’s a very compelling story. Two major power grids that span about 1/6 th of the US have seen a remarkable change in the last 8 years in terms of the contribution of renewables. The two grids show a major decrease in coal’s contribution of electricity to the power grids, and a major increase in the power generated by wind.
This is nothing short of historic!
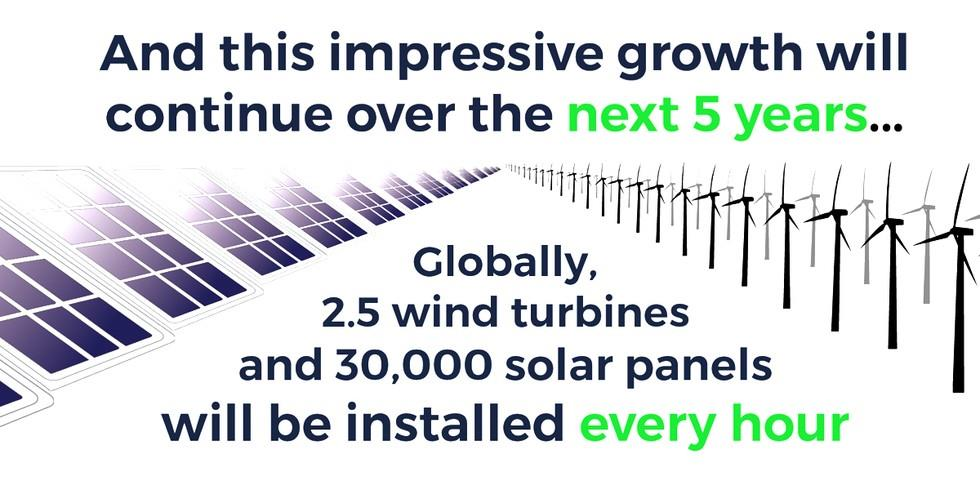
The big question is, will this trend continue? While leadership at the national level is uncertain, globally the projection for renewables looks very strong. See illustration titled, “And this impressive growth will continue...” from Fatih Birol of the International Energy Agency 25Oct2016.
Keep your fingers crossed.
The scientific career of Raymond N. Johnson, Ph.D., spanned 30 years in research and development as an organic/analytical chemist; he is currently founder and director of the Institute of Climate Studies USA (www.ICSUSA.org). Climate Science is published the first Sunday of every month.