“History is a Race Between Education and Catastrophe”: Climate Change
This is a partial quote from H.G.Wells [1866 – 1946] the English author and historian. He wrote “The War of the Worlds”, “The Time Machine” along with many others, and this line is from his book “Outline of History” published in 1920. In full, it reads “Human history becomes more and more a race between education and catastrophe.”
And so it is with climate change. Recent public poll numbers [Science, 330,p362,23October2015] in America states that 70% believe in climate science [Poll by U. Michigan and Muhlenberg College.] This is a significant increase from a few years ago and education and awareness have probably contributed to this shift. Another poll indicated only 20% favored increased taxes to address issue however.
Keeping the theme of education and climate change science front and center in the public eye, was also evident on the walls of the Gare du Nord subway station in Paris no less. Here the walls prominently displayed many mathematical equations from climate models [See Photo: Cheryl Hogue/C&EN]. The equation basically relates changes in temperature, greenhouse gas[GHG] concentrations and time.
This busy station was used by many of the attendees at the Paris Climate Change Conference [COP21].
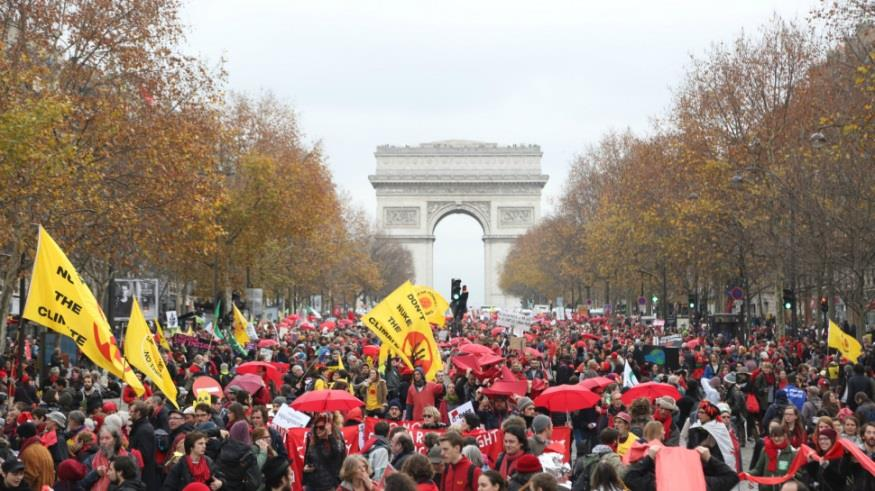
The agreement that resulted from COP21 that ended in Paris on December 12, 2015 provides a measure of hope. [Photo; Arch De Triomphe, from 350.org] The fact that this agreement was supported by 195 countries is a big step forward.
But as always the devil is in the details. Each country submitted INDCs, or Intended Nationally-Determined Contributions, which indicated the reduction of carbon dioxide emissions they pledged to make in the future. There is no mechanism specified to enforce these intended cuts and indeed these cuts, if carried out, will still fall far short of what is needed. However, it is an important start.
Note the graph, “Global Greenhouse Gas Emissions” from www.climatescoreboard.org . The bottom horizontal axis is in “Years,” and the vertical axis is “Global Emissions...”
There are three curved lines noted: the top curve “No Action” is the “business as usual” scenario. This assumes we will continue to burn fossil fuels at an ever increasing rate just like we are doing now. It shows that Earth will warm by about 8.1 degrees Fahrenheit [F] by 2100. Trying not to sound too alarming, the word catastrophic does come to mind.
The middle curve is “Current INDCs” which is how the climate will react to the pledges made by the almost all of the countries [195 and counting] on the planet. The temperatures indicated assume that these pledges will be fulfilled. This curve shows that Earth will warm by 6.3 degrees F. which is still far above the level that scientists think is safe and will cause major disruptions to our climate and to our civilization.
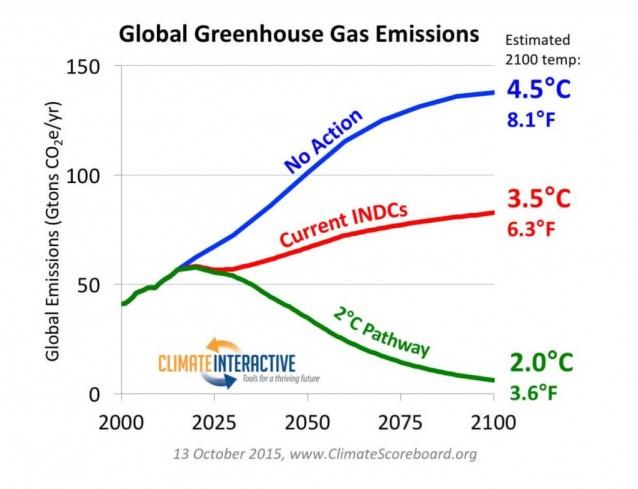
To have any hope of maintaining an inhabitable climate we would at least need to follow the bottom curve “3.6 ºF Pathway”. The hope is that with periodic reviews and progress, the pledges will be strengthened and countries will be basically shamed into cooperation and compliance.
Even better, the “3.6 ºF Pathway” in the graph, is now recognized by most scientists as too high a bar. That limit was developed years ago but based on current understanding of Earths’ climate system is now considered too high. This is based in part on the frequency and severity of extreme weather events that have been happening around the globe.
The new stretch goal is to keep global temperatures from rising more than 2.9 ºF or 1.5 ºC compared to pre-industrial times. This is a major recognition of the state of the science and concern for the planet and all its inhabitants.
To get 195 countries to agree on these numbers is nothing short of historic.
Meanwhile, all of those GHGs we have put into the atmosphere keep doing what they do with the properties endowed in them by the Big Bang. They keep absorbing energy that would normally emitted into space.
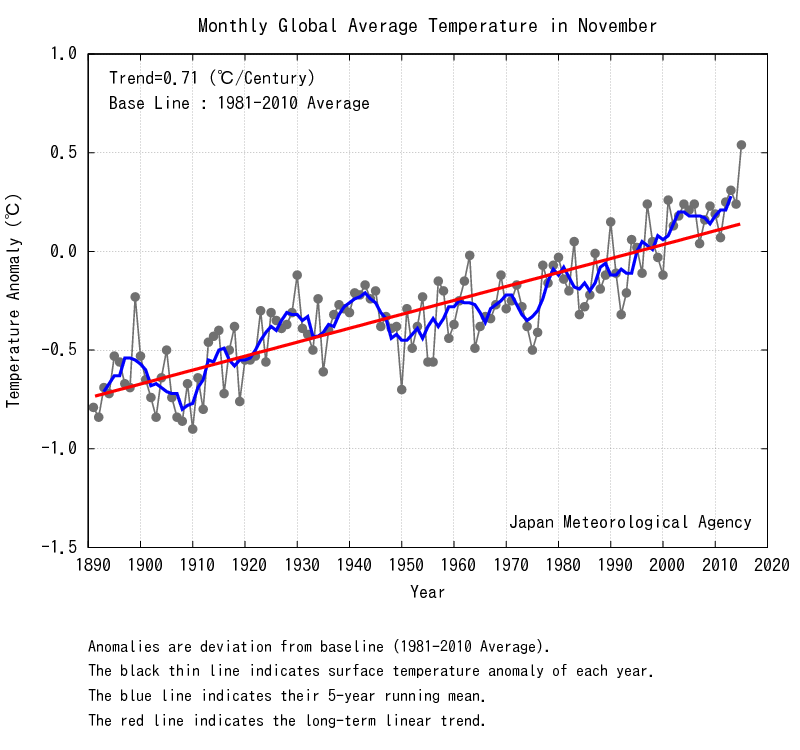
The graph “Monthly Global Average Temperature in November” clearly illustrates this [Japan Meteorological Agency]. November broke all records for the warmest November in the 125 year data record; by a wide margin.
Keep your fingers crossed.
And so it goes.
The scientific career of Raymond N. Johnson, Ph.D., spanned 30 years in research and development as an organic/analytical chemist; he is currently founder and director of the Institute of Climate Studies USA (www.ICSUSA.org). Climate Science is published the first Sunday of every month.


