


March 2011 - Weirding Weather and the Human Fingerprint on Climate Change
It is always a challenge to look out the window, observe the weather, and keep in mind that it is ‘weather’ we are observing and not climate. The recent cold spell in January 2011 is a case in point. While the North Country experienced many subzero readings, other places 1,200 miles due north did not.
Indeed, in the Canadian province of Nunavut, the town of Coral Harbor which is close to the Arctic Circle at 64 degrees North Latitude and is located at the northwest corner of Hudson Bay, temperatures on 6 January 2011 were a remarkable 54 F degrees warmer than average!
That is not a misprint.
Indeed, until 2011 this year, on January 5th and 6th, above freezing temperatures had never been recorded there for the entire first three months of any year.
This data is from University Corporation for Atmospheric Research (UCAR) in Boulder, CO. This organization manages the National Center for Atmospheric Research (NCAR) with major sponsorship from the National Science Foundation (NSF) which provides facilities, research and services for the atmospheric and Earth sciences community. See www2.ucar.edu/currents/.
The surface temperature map here for North America, from NOAA, shows the temperature anomalies for the dates 17 December 2010 to 15 January 2011. The media keeps us well informed about the cooler/cold weather at home (note lighter shaded areas), such as can be seen here in Georgia and the southeast U.S. where average temperatures were 5 – 10 F degrees cooler, and in the U.K. which had the coldest December in at least a century. However, other global weather anomalies are barely or not covered at all.
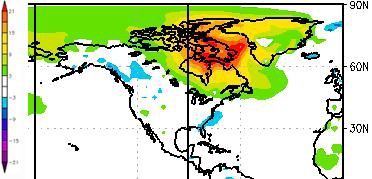
(Image courtesy NOAA/ESRL/PSD Map Room.)
What really jumps out on this map (the link below will give an image in color), are the very high temperature excursions calculated by NOAA’s Earth Systems Research Laboratory, seen over a large swath of Arctic territory in northern Canada and Nunavut. Iqaluit, the capital of Nunavut on Baffin Island and also at 64 degrees North Latitude, was planning on having a New Year’s snowmobile parade on Frobisher Bay but had to cancel because of the lack of ice and snow. The big news in 2009 was that the ice was unstable and breaking up according to Bob Henson of UCAR.
And there is more.
According to The Vancouver Sun, January 6, 2011, the rising temperatures are also making hunting difficult for Inuit hunters. The thinning ice makes travel difficult and the prey harder to find. Traditionally hunting could start in November when freeze up occurred but this year it took until early January, according to Alookie, who manages the Nattivak Hunters and Trappers Organization in Qikiqtarjuak. This community, formerly known as Broughton Island, with a population of about 500 just east of Baffin Island for you geographers, lies 60 miles north of the Arctic Circle in Davis Strait with Greenland to the east.
So what is going on? The fact of the matter is that climate scientists don’t know for sure. Observations, data, and studies are giving some hints but are still incomplete. It may take several more years before a better understanding of these climate anomalies are available. Meanwhile the data keeps streaming in.
In weather forecasting one of the major pieces of data that meteorologists look at are the 500 millibar pressure contours in the atmosphere. It provides information on wind direction, speed, rising a/o falling air masses and so on. A Google search of “500 mb” provides far more detail than space available here for you weather aficionados. Suffice it to say that a vast bubble of high pressure was observed in Dec/Jan over northern Greenland. At the center of this high the 500 mb contour rose to a much higher altitude than normal and “that this was the most extreme 500 mb anomaly anywhere on the planet in weather analyses dating back to 1948,” according to Stu Ostro of The Weather Channel.
In a New York Times article, 1/25/2011, author Justin Gillis discusses this apparent flipping of the weather: unusual cold and severe snowstorms to the south and abnormally warm ice free weather to the north. The title, “Cold Jumps the Arctic ‘Fence’” provides a glimpse into the thinking about what may be happening.
The immediate cause is clear enough. Normally, atmospheric circulation tends to pen in the cold polar air and keep it to the north. Not so for the past two years. This Arctic ‘fence’ has broken down permitting big tongues of cold air to descend far to the south and warm air masses to move north. The reason for this may be the drastic reduction in Arctic sea ice according to some climate scientists. See the Chart “Average Monthly Arctic Sea Ice Extent.” The 32 years of January ice data show an up and down ‘weather’ variation year to year, but overall, it is clear that “… Sea Ice Extent” is in steady decline. And looking at the left axis the numbers show that this decline is quite large: 1.3 million square
kilometers over this period.
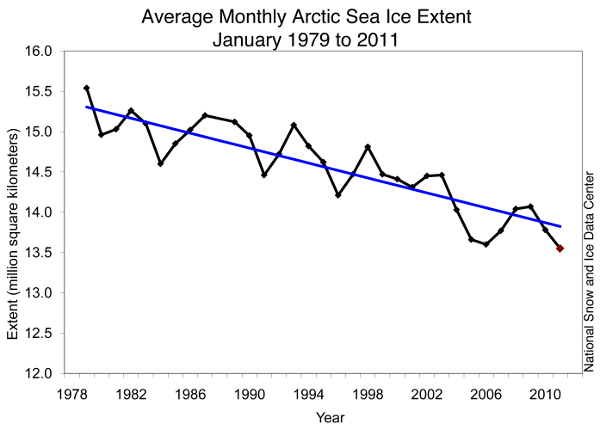
Monthly January ice extent for 1979 to 2011 shows a decline of 3.3% per decade.
(Credit: National Snow and Ice Data Center)
In the satellite image of the high Arctic from December 21, 2010 (labeled “The year the sea forgot to freeze”), one can see Greenland (large white mass in center), with the North Pole (the black circle in the upper right), and Hudson Bay with the Canadian archipelago (left).
What astonished the scientists was the amount of open water in Hudson Bay and the seas to the west of Greenland. These are normally frozen in late November. “The Meteorological Service of Canada was still writing marine forecasts as of 7 January, well beyond anything we have ever done,” according to David Phillips, a senior climatologist with Environment Canada.
The year the sea forgot to freeze
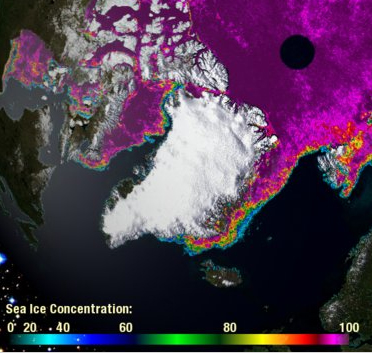
Large areas of open water persisted across much of the area between Greenland and Canada
on 21 December 2010. (Image courtesy Cryosphere Today.)
In his book, ”Hot, Flat and Crowded,” Thomas Friedman uses the term “global weirding.” It actually was “a term used by Hunter Lovins, cofounder of the Rocky Mountain Institute, to explain that global warming is going to trigger all sorts of unusual weather events… The weather is going to get weird”.
Climatologists are not of a single mind yet as to a full explanation of these recent events. James E. Overland, a climate scientist with NOAA, thinks that the declining sea ice (see Chart “Average Monthly Arctic Sea Ice Extent”) is having an effect. With more ice melt occurring in the summer, more energy is absorbed by the Arctic Ocean. This energy is then given up slowly as the season progresses causing the atmosphere to be less dense. This influences wind speed and direction directly impacting North American weather.
The Polar Research Board, a subgroup of the U.S. National Academy of Sciences, issued a strategic report suggesting that Arctic and Antarctic researchers collaborate more closely to better understand the science and become more bi-polar in outlook. The concern, and urgency, is that these two areas are “highly coupled systems” and could be providing common responses to climate change.
“And so it goes.”
The scientific career of Raymond N. Johnson, Ph.D., spanned 30 years in research and development as an organic/analytical chemist; he is currently founder and director of the Institute of Climate Studies USA (www.ICSUSA.org). Climate Science is published the first Sunday of every month.