


April 2011 - Climate Science: Indicators of Human Fingerprint on Climate Change
Two central questions in Climate Science are: is our planet warming, and, if so, are human activities primarily responsible? The 2007 Report from the Intergovernmental Panel on Climate Change (IPCC): The Physical Science Basis, makes it very clear.
This report, free and available on-line, consisting of 996 pages of text, data and graphs, states on page 252, “Instrumental observations over the past 157 years show that temperatures at the surface have risen globally, … ” and “An increasing rate of warming has taken place over the past 25 years, … .” Ten indicators of a warming world were discussed in an earlier article here [9/5/10] and can be found in www.ICSUSA.org .
On page 665 this same IPCC report states, “Human-induced warming of the climate system is widespread.” Also, “Greenhouse gas forcing has very likely [greater than 90% probability] caused most of the global warming over the past 50 years.” Physicist John Cook published the following chart based on the many lines of evidence and data in the IPCC report and the NOAA “State of the Climate 2009” report [also available free and on-line]. His chart highlights 10 indicators of the human fingerprint on climate change.
We have room today to discuss just two of these. However, climateprogress.org, August 10, 2010, does provide information and peer reviewed references for all 10.
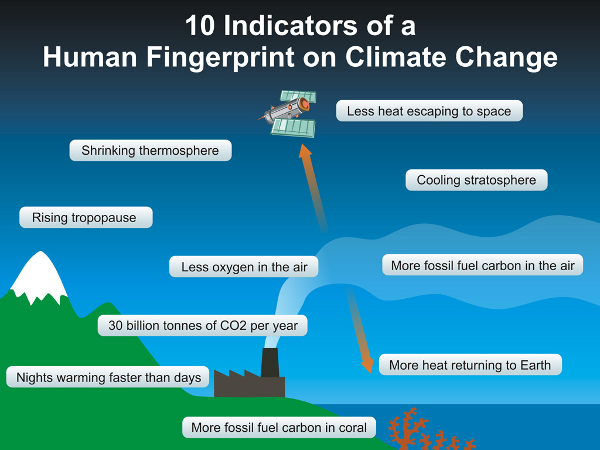
Let’s look at one of the indicators in the chart, “Less oxygen in the air.” When we combust carbon, from coal, oil or natural gas in order to extract the energy from it, we use two oxygen atoms to convert each carbon atom to carbon dioxide. This is the basic chemistry of that process. This oxygen has to come from someplace and indeed, it does: it comes from the air around us. Careful measurements of the oxygen content of our atmosphere show the levels to be falling in conjunction with the rising amount of carbon dioxide which is exactly what one would expect.
Let’s look at another indicator, “More fossil fuel carbon [carbon-12] in the air.” Carbon atoms come in two primary forms [isotopes]. One of these is carbon–14 which is formed in the atmosphere on a natural basis [by cosmic rays] and is radioactive. It has a half-life of about 5,730 years and is formed and decays so that the amount in the air at any one time is normally constant. This is no longer the case.
Stay with me now.
When scientists measure the different isotopes of carbon in the atmosphere today, they find that the relative amount of carbon-14 compared to carbon-12 is decreasing. Since fossil fuels have been buried in the earth for millions of years, all of the carbon-14 isotope has decayed. Thus when these fuels are combusted they release the stable form of carbon [carbon-12] into the air. These emissions dilute the levels of carbon-14 normally present, which tells us that the increased amount of carbon dioxide in the atmosphere is coming from human activities.
Climate science and science in general, is not like a house of cards and is not based on a single line of evidence. There are many, many lines of evidence and data that collectively point to a single, consistent answer: namely, that rising carbon dioxide levels from fossil fuel burning is the main driver behind global warming.
The data continue to come in. The graph here of “Arctic Sea Ice Extent” is current through March 22, 2011. Sea ice extent normally reaches its maximum in the period from February 18 to March 31. This year the maximum extent, so far, was reached on March 7 and at 5,650,000 square miles
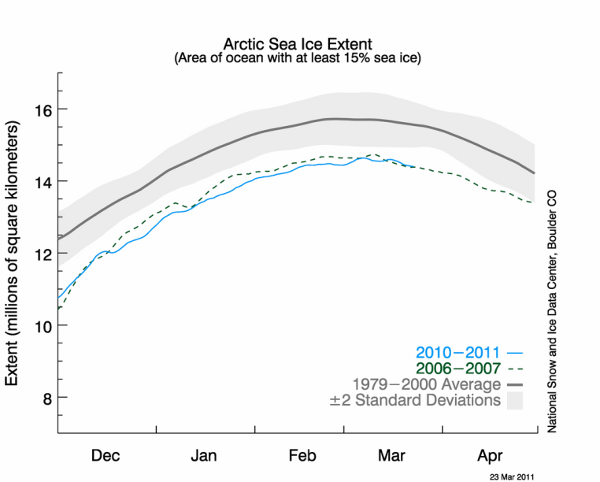
is 463,000 square miles below the 1979-2000 average. This reduction in ice extent equates to an area larger than the states of California and Texas combined. That is a lot less ice.
One reader sent me a curious email, “Icebergs in Lake Michigan.” Indeed one photo showed a building sized chunk of ice floating in the water. Close examination of the photo revealed many layers of ice in the mass not un-like one sees in tree rings. This was a multi-year iceberg from a glacier, not seasonal ice, and certainly not from Lake Michigan. One can only guess why this misinformation is circulating on the web.
NASA Report: CO2 at 391.7 ppm as of February 2011 at Mauna Loa Observatory: pre-industrial level ~280 ppm.
“And, so it goes.”
The scientific career of Raymond N. Johnson, Ph.D., spanned 30 years in research and development as an organic/analytical chemist; he is currently founder and director of the Institute of Climate Studies USA (www.ICSUSA.org). Climate Science is published the first Sunday of every month.