


The scientific career of Raymond N. Johnson, Ph.D., spanned 30 years in research and development as an organic/analytical chemist; he is currently founder and director of the Institute of Climate Studies USA (www.ICSUSA.org). Climate Science is published the first Sunday of every month.
October 2010 - Arctic transformed at hands of climate change
On 19 May 1845, Sir John Franklin set sail from the Thames River, England searching for the famed, long sought Northwest Passage: a northern sea route across the Canadian Arctic from the Atlantic to the Pacific. This passage had been a quest by explorers for centuries as a shorter route to the orient.
There were 129 men in his two ships, the Erebus and the Terror. In addition to the necessary provisions for up to a three year voyage, the ships carried all of the silverware, china and crystal that the officers of the Royal Navy were accustomed to. They were last glimpsed by some whalers near Greenland on June 25, 1845, and then they disappeared.
Captain Franklin was an experienced Arctic explorer. He was even called 'the man who ate his boots' by the Inuit, because of a mishap on one of his earlier explorations where he nearly starved to death, but his courage and experience was extensive.
Historians today believe that at some point his ships became frozen in the ice, and not released by the summers thaw: the ships were eventually lost and have never been recovered. Over a 12 year period over 50 expeditions searched for him. Only the remains of a few of the officers and men have been found scattered around the Arctic that tell of horrible hardship. (The Arctic Grail, by Pierre Berton).
The Arctic Today
The Arctic of today is a very different place. On a visit to Beechey Island one can still see the barrel staves and opened tin cans from what is believed to be their first original campsite. A chill, but not cold wind blows, but no ice is in sight on this August day. No green is visible either, even if one gets down on all fours and looks across hundreds of feet of the stone shingle terrain.
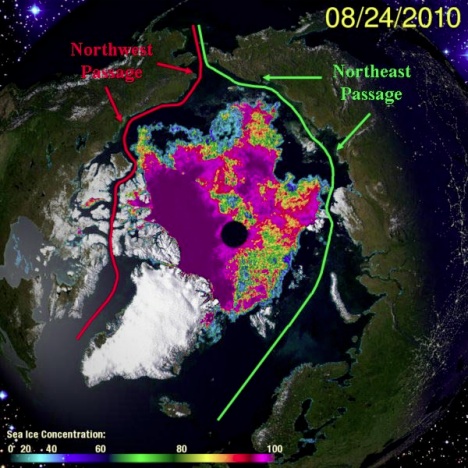
The recent satellite composite image here (8/24/2010) tells the story of the Arctic today. The Arctic, we recall, is an ocean surrounded by land. This is the exact opposite to the Antarctic where we have a continent surrounded by ocean. This image from the National Snow and Ice Data Center (NSIDC), and carried on "The University of Illinois Cryosphere Today" website, has the North Pole in the center as a dark circular dot. It is surrounded by varying shades of color which denotes ice thickness (see intensity stripe across bottom).
The image, with Canada to the left, Alaska to the upper left and Russia from top to most of the way down on the right ending with the Scandinavian countries: Greenland is the large white mass on the bottom left. The legendary Northwest Passage across the Canadian Arctic is completely clear, as is the Northeast Passage along Russia's land boundary as can be seen.
Ice Extent
This summer marks the 4th year in a row — and the 4th time in recorded history — that the fabled Northwest Passage has opened for navigation. Indeed, 18 ships have travelled through this passage and cleared customs this year in Inuvik according to the Canada Border Services Agency. In 2009 the number was seven. It is also possible now to circumnavigate the Arctic through both passages in ice-free waters and this is the 3rd year in a row and the 3rd time in known history that this was possible. Indeed, a company, Beluga Shipping, was the first shipping company last year to transport goods in two ships from South Korea through the Northeast Passage to Siberia.
The polar explorers of the past would be astonished at how the Arctic looks today.
Normally, minimum sea ice in the Arctic occurs in mid-September before it starts to grow again during the long Arctic winter. According to the NSIDC minimum sea ice extent occurred about September 19 and was the third lowest in the data record, behind only 2007 and 2008. It was far less than the average extent from 1979 to 2000.
Ice Volume
From a climate perspective what is important is not just extent, but sea ice volume, which gives a more complete idea of the warming occurring in the Arctic. Thin ice melts much more quickly than multi-year thick ice.
So let's look at ice volume as depicted in the graph. The cube on the left has a faint outline of the volume of summer Arctic sea ice in 1979. The inner and smaller dark cube schematically illustrates the amount in 2009. Note that the ice volume during that time has changed from 20,770 cubic kilometers to 7,958 cubic kilometers, a decrease of about 55%.
The right side of this chart graphs the "Changes in Sea Ice Volume" when the daily volume is compared with the 1979-2000 average for that day. This data is from an article in New Scientist 31 August 2010 by Chris Mooney. It should be noted that a PIOMASS model has been used for much of this work. It was developed at the University of Washington's Polar Science Center in Seattle. While the last several years data correlate well with ICESat satellite (which failed earlier this year) measurements, earlier years data are also consistent with earlier satellite, Navy submarine, moorings and field measurements data.
Let's not forget some other recent news accounts taking place in the Arctic. On August 4th 2010 a large chunk of the Petermann Glacier on Greenland broke off, which at this time is the largest iceberg in the northern hemisphere. It is about 150 square miles in size or about four times the size of Manhattan. It is so large that it might get stuck in Nares Strait, a narrow passage way between Greenland and Canada's Ellesmere Island, and not move south into the north Atlantic and its shipping lanes until it breaks apart into smaller chunks.
In 2008, another iceberg about 20 square miles in size broke off from this same glacier.
In mid August this year a huge chunk of ice about the size of Bermuda cracked off Canada's largest glacier, the Ward Hunt Ice Shelf. It has clung to the shores of Ellesmere Island for the last 3,000-5,000 years and contains the oldest sea ice in the northern hemisphere.
The science and data continue to be published. The permafrost area in the Arctic continues to decrease; methane releases from the tundra and its lakes appear to be increasing with attempts to measure this still underway; shoreline erosion continues to worsen as ice-in dates occur later in the fall; fish and other wildlife species are found further north than ever spotted before; pine bark beetles killing millions of trees in Alaska as the cold weather that kept them in check is no longer as cold.
The number of observed changes associated with global warming continues to increase. The energy imbalance is still there and with more energy entering our planet than is leaving, more changes will occur.
A lot more evidence of climate change is happening in the Arctic but more about that another time.
Note: The September 5, 2010 Climate Science article in the Press Republican was missing a critical chart. The article in its entirety can be found on the first page in ICSUSA.org.