


July 2010 - Events of 2010 fit description of Global Weirding
Global Weirding is an interesting term.
As explained by Thomas Friedman in his 2008 book "Hot, Flat and Crowded," this term was first used by Hunter Lovins in an attempt to describe to people that the rise of global temperatures will cause all kinds of unusual weather effects.
This would include events such as more heavy snowstorms, frequent intense rainfalls, extreme flooding and … well, I think you get the picture.
Tracking Temps
So what does the data show? An Oct. 19, 2009, paper by lead author Gerald Meehl, a senior scientist at the National Center for Atmospheric Research, titled "The relative increase of record high maximum temperatures compared to record low minimum temperatures in the U.S.," tries to put our recent experiences into perspective.
The co-authors include staff from Climate Central, The Weather Channel and NOAA.
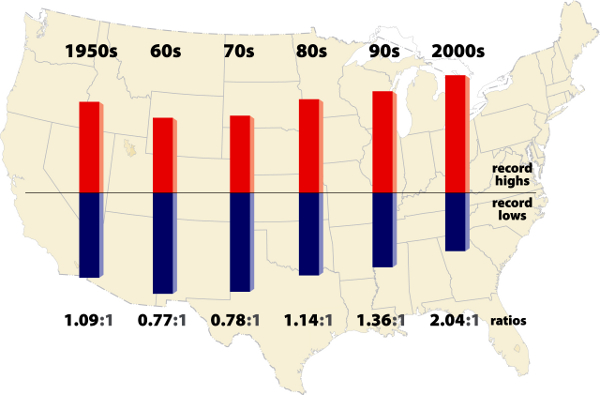
The bar-chart graphic shows the ratio of record daily highs to record daily lows. The data comes from 1,800 weather stations in the lower 48 states over the past 60 years.
Pronounced Warming
In the period Jan. 1, 2000, to Sept. 30, 2009, these 48 states set 291,237 record highs and 142,420 record lows, giving us the ratio of 2.04 shown.
The earlier five decades were calculated in a similar manner. The warming trend is clear and correlates with global temperature increases and the enormous increase of greenhouse gases, mostly carbon dioxide, being emitted into the atmosphere.
This decade's warming happened to be more pronounced in the western United States. Here the ratio was well more than 2 to 1 while in the eastern United States, the ratio was about 1.5 to 1. These regional differences are not unexpected and are consistent with what climate models indicate.
These models also indicate that with business-as-usual in terms of greenhouse-gas emissions, the ratio record highs to record lows could increase to 20:1 by mid-century.
Records Set
And the data continues to come in.
On June 15, 2010, the National Climate Data Center released its summary of global climate conditions so far this year. The data show that May 2010 and the five-month period from January to May 2010 were the warmest since thorough record keeping began in 1880.
Further, the 12-month running mean global temperature reached a new record in 2010. This period also coincides with a sunspot minimum when solar irradiance is also at a minimum. The data do not support climate skeptics' claims that the Earth cools during sunspot minimums.
RHODE ISLAND FLOODS
Let's look at some more recent "weirding" events.
It is called the Great Rhode Island Flood of 2010. On March 30, it began to rain and by the next day had dumped up to 9 inches of rain in and around Providence. Flood levels exceeded all records that date back to the 1870s. Some homes, not in a flood zone and not covered by insurance, did not escape this deluge.
The state was declared a disaster area by the president, and the governor described it as "flooding of historic proportions."
This was the third heavy rain storm in March for eastern Massachusetts, Rhode Island and Connecticut and is "unprecedented in our recent 100-year weather history," according to the National Weather Service.
Tennessee Tragedy
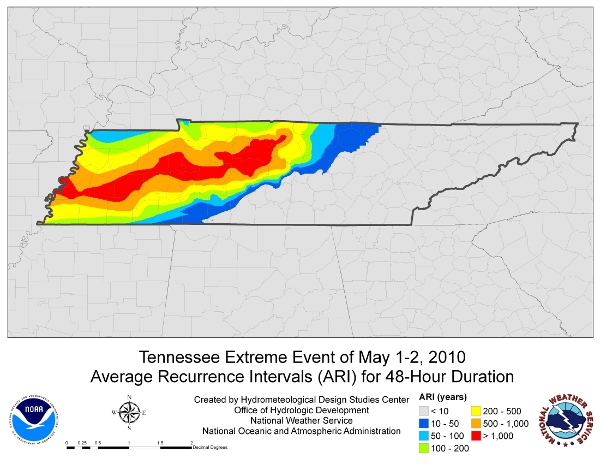
On May 1, 2010, rain began falling in Tennessee. Thirty-six hours later it had dumped record breaking amounts of between 12 and 20 inches of rain across the western and middle parts of the state devastating 52 of its 95 counties. It is considered one of the epic extreme weather events in U.S. recorded history and was called an "unprecedented rain event" by Associated Press. At least 33 people died.
A You-Tube video shows a large temporary classroom building floating down the interstate highway near Nashville, bumping into submerged vehicles. The flooding washed away bridges and homes and destroyed businesses and infrastructure. Even the stage at the Grand Ole Opry was under water.
The national weather map here shows the rainfall pattern over the state. The darkest section on the map shows that this event should only occur once in more than 1,000 years. Damage estimates now exceed $2 billion.
Arkansas Deaths
It does not stop there.
In western Arkansas on June 10, 2010, floodwaters caused by torrential rains of up to 7 inches, coursed through a valley filled with campers. Water levels at one point rose 4 feet in ½ hour, and many people were still in their tents when they began to fill with water. The water level rose overall about 20 feet and poured through the valley with such force that it peeled asphalt off roads.
The death toll was at least 17 people, and the governor of Arkansas said, "I've seen flooding before, but I have never seen water do this kind of damage."
More Heavy rains
Oklahoma City experienced its heaviest one-day rain event in history on June 14 and 15, 2010. Widespread rain amounts of 8-11 inches saturated the city and brought about extensive flooding in what is considered a 1-in-500-year event. No loss of life is known to have occurred.
On June 18, 2010, more than 14 inches of rain fell in southern France near the Mediterranean coast in just a few hours. Many of the more than 25 people that died were swept away by torrents of muddy water. It was estimated there were more than 200,000 households without electricity and is considered the worst flooding there in two centuries.
For comparison purposes, the North Country typically gets about 40 inches of rain a year.
Warning
So what does this litany of weather events mean?
It does not even cover the snowstorms during this past winter or even the hottest temperatures ever recorded in Asia (128.3 degrees in Pakistan on May 26, 2010); nor the fact that Kuwait, Iraq, Saudi Arabia, Chad, Sudan, Niger and Myanmar (Burma) set all-time country high temperatures in the last few weeks. It is pretty clear. A science based report "Global Climate Change Impacts in the United States" commissioned by the Bush Administration in 2007 and released in June 2009, warned that "the United States would see greater instances of severe weather and heavier rainfall."
Evan Mills, a Berkeley scientist and contributor said: "This is the most thorough and up-to-date review ever assembled of climate change impacts observed to date as well as those anticipated in the future across the United States."
This 188-page report is free and available on the Web.
The scientific career of Raymond N. Johnson, Ph.D., spanned 30 years in research and development as an organic/analytical chemist; he is currently founder and director of the Institute of Climate Studies USA (www.ICSUSA.org). Climate Science is published the first Sunday of every month.