April 2010 - Ice ages: They come and go - but why?
We are told by geologists and other scientists that a massive ice sheet, more than a mile thick, covered a large portion of North America.
It almost seems like a fairy tale. But a walk along the Lake Champlain shore, or in the low lands of Vermont and New York, reveals traces of this spectacular event.
It is hard to imagine today when standing on Rattlesnake Mountain near Willsboro, or Pok-O-Moonshine near Keeseville, on a lovely warm day, that ice covered this area as far as the eye could see. All of the peaks would have been covered (a few tips may have poked through) and all one would see was white: ice. That ice sheet grew over tens of thousands of years, spreading down from northern Canada and reaching as far south as New York City. Then it all melted and nature was primed to repeat itself with another 100,000-year-or-so cycle.
Let's see what science tells us and look at the first chart. It is a bit busy but full of interesting data. The figure is taken from the Intergovernmental Panel on Climate Change Report AR4 "Climate Change 2007" (page 444). It shows four complete tracings, and a partial one, with information on ice volume (bottom line), temperature (second line from bottom), and the levels of three greenhouse gases, methane (third line from the bottom) and carbon dioxide (fourth line from the bottom). The incomplete top line is the available data on nitrous oxide. All of this data was obtained from ice core samples from Antarctica.
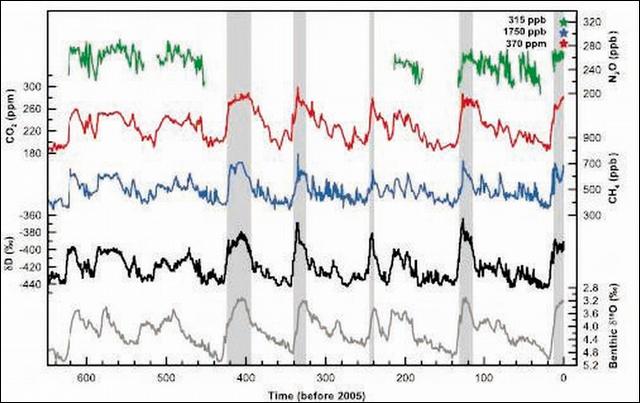
The interesting aspect here is that we now have information on at least six different ice ages over the past 650,000 years. The time axis along the bottom is in hundreds of thousands of years. The five vertical shaded areas are the warm periods, in between the glacial periods, such as the interval we are in now (vertically shaded area at the far right). These warm periods are when the glaciers melted and the climate was much as we know it today.
Another aspect to this data is that these ice sheets waxed and waned, except for the most recent one or two, before we Homo sapiens, were even around. Man had nothing to do with the growth or retreat of these ice sheets. Indeed, some of our ancestors such as perhaps H. neanderthalensis, H. erectus and H. heidelbergensis, experienced the same major climate-change issues and they did not cause them either.
Some scientists believe that the stresses and forced adaptations that these climate-change experiences had on early Homo species over the past 1 million years or so actually shaped their tools, culture, art, versatility and creative abilities. The Smithsonian's National Museum of Natural History, in Washington D.C., attempts to address this topic in an ongoing exhibit there right now, but this is another whole story.
Let us focus on the data again. Note that the ice volume decreases as the temperature curve increases. Makes sense, doesn't it? The three GHG tracings also increase as the temperature rises. This also seems reasonable as biological activity increases with increasing temperature, and oceans warm and emit dissolved gases into the atmosphere. (Units on the vertical axis are presented in a way to make this clear — their full definition can be found online in the IPCC Report.)
What the data would also show, although not obvious here because of the compressed timeline, is that the levels of the GHG begin to increase after melting of the ice begins. GHG did not cause the initial melting. The melting started first followed by the subsequent contribution of the GHG.
So what gives here? How can this be?
Several scientists in the 19th and early 20th centuries, based on their observations and work in the Alps and elsewhere, noted that several ice ages had come and gone, and they began to suspect that Earth's orbital cycles were a possible explanation. What does this mean? Our planet spins just like a child's toy top. If you play with one it becomes obvious that there are complex movements of the spinning top depending on a number of variables: how hard it is spun, the angle with which it is placed on a flat surface, and so on.
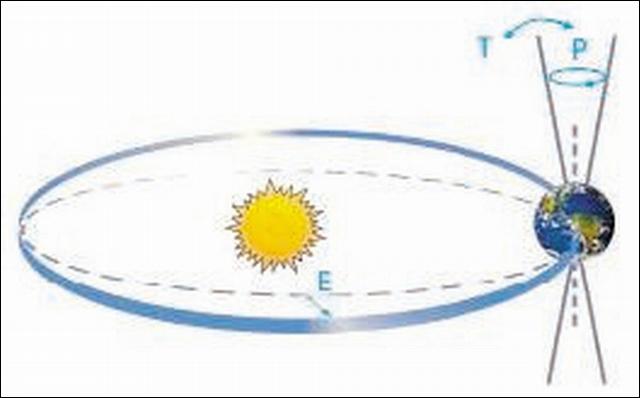
Let's look at the second figure, also taken from the IPCC 2007 Report (page 56). This diagram of the Earth's orbit around the Sun tries to capture this complexity of different movements. Three letters are shown: e for the "eccentricity of the Earth's orbit around the Sun" and measures how the Earth's orbit ranges from nearly circular to elliptical; P is for precession and "refers to changes in the time of the year when the earth is closest to the Sun"; and T is for the tilt of the Earth's axis, which modulates the distribution of the Sun's energy at different latitudes.
Now, enter Milutin Milankovic, a mathematics professor at the University of Belgrade who began his career in 1909. He was aware of the physics of the three variables defined above (e, P and T) and the fact that they occurred in regular cycles, which varied from about 19,000 years (for P) to as much as 400,000 years (for e) .
When the cycles of these three variables overlap periodically, and essentially reinforce each other, he knew this could have a large effect on the incoming solar energy at high latitudes. If the Earth was closer to the Sun (e), and had a maximum tilt (T), and both of these occurred when P was such that the Northern Hemisphere received more of the direct rays of the Sun, then melting would occur. When the cycles overlap in the reverse sense, then an ice sheet would start.
Still with me? Don't worry: it's OK, but let's keep plowing on as it is the concept, not the detail, that is important.
Milankovic was able to calculate what the maximum energy input was at high latitudes (more than 45 degrees North) and show that the ice sheets would have melted. He was able to do the reverse, as well. When the cycles were aligned in such a way that a minimum of solar energy was received at high latitudes, his calculations showed the ice sheets would begin to form and advance. It took him almost 30 years to complete the formulation of this theory, with interruptions by wartime service and other matters, and with all of the energy calculations done by longhand, on paper, without a PC.
It took decades before his ideas were accepted and while they may not be a complete explanation of Earth's recent climate history, they have provided a solid foundation on which climate change is understood.
So what's the problem, anyway? Climate Change is natural, right? What's this about global warming? The issue is, to paraphrase a recent paper in Nature (Vol. 453, May 15, 2008, page 353), the physical and biological changes observed on our planet over the past 50 years is due to warming caused by anthropogenic activities (including GHG); we are no longer in a natural cycle of warming and cooling.
We are changing the way that nature has operated for millennia with consequences still to be determined.
The scientific career of Raymond N. Johnson, Ph.D., spanned 30 years in research and development as an organic/analytical chemist; he is currently founder and director of the Institute of Climate Studies USA (www.ICSUSA.org). Climate Science is published the first Sunday of every month.


