


September 2009 - Extreme weather events and connection to climate change
Let's go behind some of the recent headlines on flooding and major precipitation events that we have read about recently.
The most recent report issued by the Intergovernmental Panel on Climate Change (IPCC) in the fall of 2007 addresses this directly on page 783 of that same report. To the question "Are Extreme Events Like Heat Waves, Droughts or Floods, Expected to Change as the Earth's Climate Changes?" it gave the simple answer "Yes" and then proceeded to address this issue in detail.
To provide this simple answer climate scientists in various research centers around the world have turned to the most powerful computers available to man. While our atmosphere is a thin skin only a few miles deep around our planet home that is 25,000 miles in circumference, it is influenced by a host of factors.
These factors include: ocean circulation patterns, atmospheric aerosols, concentration of greenhouse gases (such as carbon dioxide, methane, nitrous oxide, ozone and others), sea surface temperatures, land surface temperatures, solar insulation, sunspot activity, albedo (reflection of sun's rays back into space by snow and ice cover) and a large number of other factors.
The scientists then take these variables, build them into a computer program, and try to predict what will happen as our planet continues to warm. To determine if these programs make any sense, they actually try to see if the programs will predict weather and climate that has happened in the past. The reasoning is that if the programs can forecast what has already happened, the chances are good that they can to a reasonable measure predict what will come in the future.
In the IPCC report, several models are discussed, but they all indicate the same thing: We can expect more extreme weather events in the future. Just as higher temperature air can dry out the land surface, it can also hold more water vapor and then release this larger quantity to the land surface.
Ok, it's time to review some data.
The U.S. Geological Survey (USGS) issued a news release Sept. 24 called "Atlanta Flooding Sets New Record." It goes on to say, "The flooding around Atlanta (Georgia) this week is one for the record books. "¦ the rivers and streams had magnitudes (of water) so great that the odds were "¦ 1 in 500 "¦ to be hit with such an event." "They were epic!" said Brian McCallum, assistant director for the USGS.
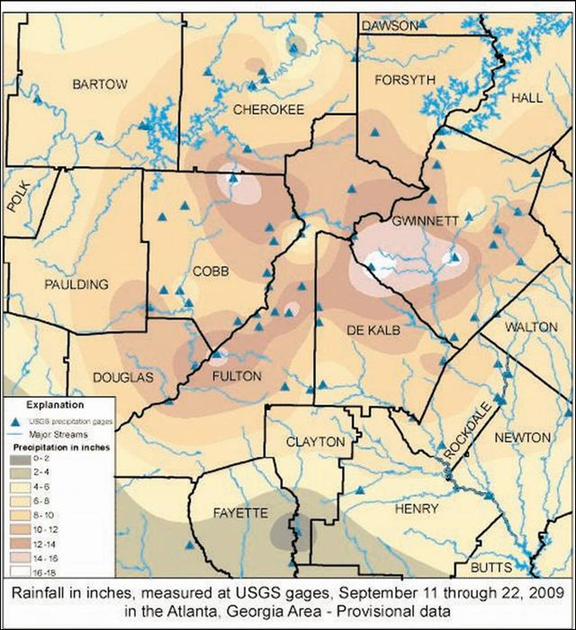
Let's look at the rainfall map, copied here for information purposes, supplied by the USGS. It is interesting on a number of accounts. The map shows the many gauging stations in the greater Atlanta area (there are a few thousand more spread across the United States). Also, the color codes show the rainfall patterns with indicated rainfall amounts of up to 16 to 18 inches, with one area receiving 21 inches in a 24-hour period. The water level at Utoy Creek, near Atlanta, surged to 27.54 feet, besting the previous record set in May 2003 by 11 feet. The water level at Sweetwater Creek crested at 30.17 feet, almost 9 feet above the previous record set in 2005. These data support the term "epic."
And this deluge follows a multiyear drought in the Atlanta area that left the city struggling for water in October 2007. At that time the state climatologist said, "This drought has broken every record in Georgia's history."
And so we have weather, and, according to all of the climate models, extreme weather events that are powerful indicators of a changing climate.
But this was not the only event. Let's look at just a sampling of recent events to give us an idea of what is happening in our atmosphere, our climate, our planet, and to us now, and what we may expect in the future.
The AP reported April 24 that the tinder dry conditions in South Carolina helped bring about the largest wildfire in over three decades to the region. The blaze was up to four miles wide, burned over 23 square miles, leveled more than 70 homes and forced the authorities to evacuate 2,500 people.
On May 9, the National Weather Service confirmed that a tornado with winds of 90 to 100 miles an hour had touched down in Central Vermont. A tornado in May in Vermont is a rare event.
Closer to home, on July 29, the hamlet of Coopersville hit the news. Although Route 9B had been repaved a few years ago, with the road engineers putting in about 20 enlarged culverts and drainage systems over the seven-mile stretch, it was still not enough. About 5 inches of rain fell in just a few hours, flooding the highway and briefly closing it.
On Aug. 14, The New York Times detailed the devastation brought about by Typhoon Morakot to the southern part of the island of Taiwan. (Note: In North America these typhoons are called hurricanes.) After five days and 80 inches of rain, yes 80 inches (almost 7 feet), the sun came out to a changed world for thousands of Taiwanese. Hillsides, farmlands, homes, towns, and some residents, were washed away by rivers that did not even exist the prior week. The government sent over 38,000 soldiers and 380 helicopters to help deal with the rescue and relief efforts.
In NYC, on Aug. 19, a microburst or downburst hit. This storm had straight line winds that gusted at 70 miles an hour, felled about 100 large trees and caused the worst damage in decades to Central Park. As the storm passed over Manhattan, the Bronx and upper Queens additional damage was incurred and all within the space of about 35 minutes.
Another report from the AP Sept. 27 covered a storm that hit Manila in the Philippines. In just 12 hours, one month's worth of rain fell on the city, 16.7 inches, breaking the old 24-hour record set in 1967 by 3 inches.
And so these extreme weather events and associated data continue to build and support a still larger database, that indicates climate change is occurring and global warming is happening now.
The scientific career of Raymond N. Johnson, Ph.D., spanned 30 years in research and development as an organic/analytical chemist; he is currently founder and director of the Institute of Climate Studies USA (www.ICSUSA.org). Climate Science is published the first Sunday of every month.