


October 2009 - Climate change in the Champlain Valley, Northeast
This year we have experienced weather that even for the North Country is a bit unusual; a few very early warm days with one exceeding 85 degrees in April, a number of days in the 30s, 40s and low 50s in May, and many rainy days in June and July with cool temperatures.
In August, we had hot and humid weather until the end of the month, when it turned cool again with temperatures in the 40s. But still, the ups and downs of temperature, rainfall or precipitation events, together with humidity are all part of the North Country weather patterns that we experience. If these variables are weather, then just what is climate?
This difference between weather and climate can be confusing. We all have heard someone say, in January for instance, when the temperature is 24 below zero, "How can we be having global warming?" or perhaps, when we have a 50-degree day in June, "Where is that global warming now?"
According to online sources, the definition between the two is as follows: "Weather is a set of all the phenomena occurring in a given atmosphere at a given time. "¦ Weather refers, generally, to day-to-day temperature and precipitation activity, whereas climate is the term for the average atmospheric conditions over longer periods of time."
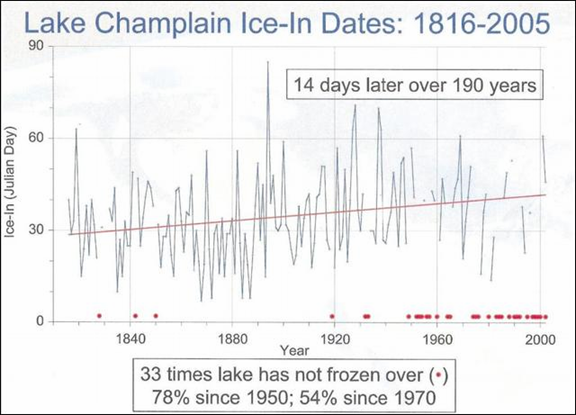
Let's look at some data that will help sharpen up this distinction. This graph (see above) was obtained from a report/lecture given by Dr. C. Wake Dec. 4, 2006, with data from the National Weather Service (NWS) in Burlington, which is part of National Oceanic and Atmospheric Administration (NOAA).
The graph is an excellent example of both 'weather' and 'climate.' It gives the "Ice-In" dates for Lake Champlain for the period 1816-2005. (The "Ice-Out" dates are not available to my knowledge.) If we look at any particular year over that long period of time on the graph, we are basically looking at 'weather.' And from the individual years we can see the normal variation of that 'weather.' But when we look at the long-term trend of all of this data, now we are looking at 'climate.'
Let's look at this information and two important conclusions we can make! First, the longtime trend line shows that when the lake does freeze over, it is on the order of 14 days later than in the past. Second, we can see the frequency of times that the lake has not frozen over. Note the dark dots along the bottom of the graph, which help locate those particular years. Over this 190-year span of data the lake has not frozen over 33 times. However, 26 of those times (or 78 percent) that the lake has not frozen over have been since 1950.
If global warming/climate change was not occurring, we would expect a flat trend line, not a rising one; and we would also expect that when the lake was not frozen over, the dots (years) would be scattered more or less evenly along the 190-year time span, not concentrated as they are toward the more recent period. The fact that global warming is occurring is not just based on this data set alone. Let's look at how this global phenomenon is impacting us locally in a number of different ways.
In an article in the Press-Republican Nov. 16, 2008, Kim Smith Dedam provides another example of warming close to home. Mirror Lake in Lake Placid is about 128 acres in size, and there exists a more than 100-year record of "Ice-In" dates for it. The data show that the lake is freezing two weeks later than it did in the past. It is interesting to note that this lake, at an elevation of 1,857 feet in the Adirondacks, has had almost the same response to global warming as Lake Champlain, which is at an elevation of about 95 feet.
Let's continue to look at more data so we can try and get a better handle as to what is happening to us locally. While we need to know globally about the melting of glaciers, loss of Arctic sea ice, diminution of ice cap mass, rising ocean levels, increased sea temperatures and so on, we also need to see what is going on locally.
The University of New Hampshire has the Institute for the Study of Earth, Oceans, and Space (EOS), which is a part of the Climate Change Research Center. The scientists, professors and students, both graduates and undergraduates, have been engaged for some time in collecting as much data as possible on all aspects of weather and climate. Going to their Web site will provide a lot of information, but let me just summarize some of their findings. Their research focus is on the Northeast United States (nine states from Penn. to Maine) together with two Maritime Provinces of Canada, New Brunswick and Nova Scotia.
The following points (also obtained from that same talk given by Dr. Wake) are not inclusive of all of their work but it gives us a good idea of some of their findings as it pertains to climate:
- The average annual temperature for the Northeast has increased 1.8 degrees F over the past 100 years with 1.4 degrees of this increase in the last 30 years.
- Winter temperatures have increased 2.3 degrees F in the last 103 years with a significant acceleration in the last 33 years.
- The annual precipitation has increased 3.4 inches over 103 years.
- In New York City, the extreme precipitation events (more than 2 inches in 48 hours) has increased from an average of two events per year from 1950 to 1970, to an average of five events per year from 1971 to 2005.
- The number of days with snow on the ground varies across the Northeast but in most places is anywhere from five to 25 days less; a few sites did show small increases of up to five days (east of Buffalo, Tug Hill plateau, Boston, Providence, R.I.).
- The average ice out day trend for 27 lakes in northern New England is 13 days earlier over the 30-year period from 1970 to 2000.
- And then, for those gardeners "¦ during the period 1965 to 2001, the lilac bloom dates are now about four days earlier.
And so, the climate change story continues.
The scientific career of Raymond N. Johnson, Ph.D., spanned 30 years in research and development as an organic/analytical chemist; he is currently founder and director of the Institute of Climate Studies USA (www.ICSUSA.org). Climate Science is published the first Sunday of every month.